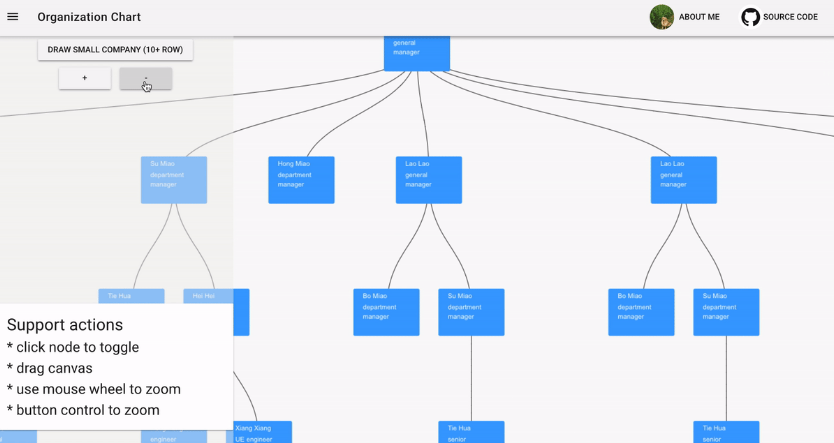
vue-tree-chart
flexible tree chart using Canvas and Svg, powered by D3.js
Using Tech
Canvas version
- use D3.js with Canvas to draw organizationChart more efficiently.
- Use
unique-colormanner to identify mouse click event in Canvas (you can refer to https://medium.com/@lverspohl/how-to-turn-d3-and-canvas-into-good-friends-b7a240a32915 to see detail)
Svg version
- use D3 to calculate node & link positon
- use Vue to handle dom element entring and leaving
- use Vue slot to let user easily use with their own data
How to use?
Svg version
1. install npm module
npm install @ssthouse/vue-tree-chart
2. register vue-tree component
import VueTree from '@ssthouse/vue-tree-chart'
import Vue from 'vue'
Vue.component('vue-tree', VueTree)
3. use component
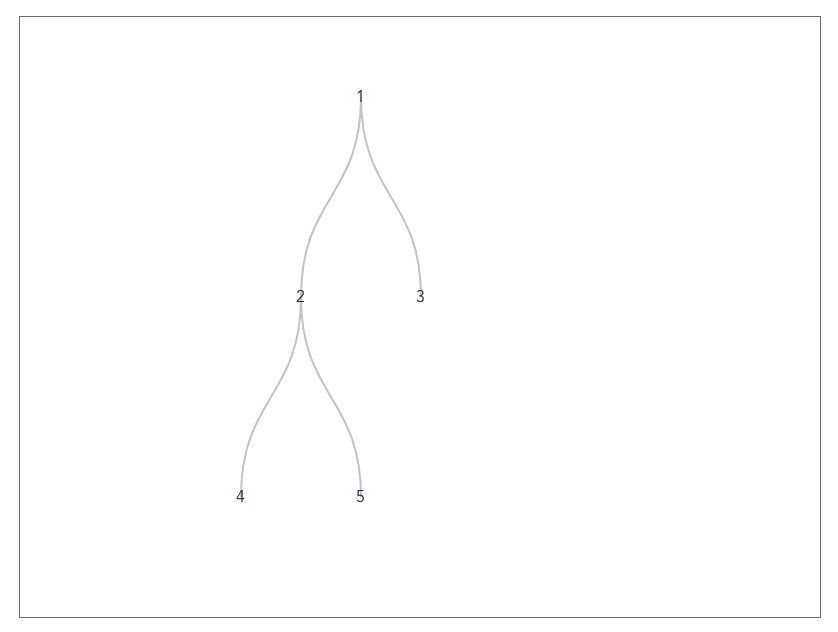
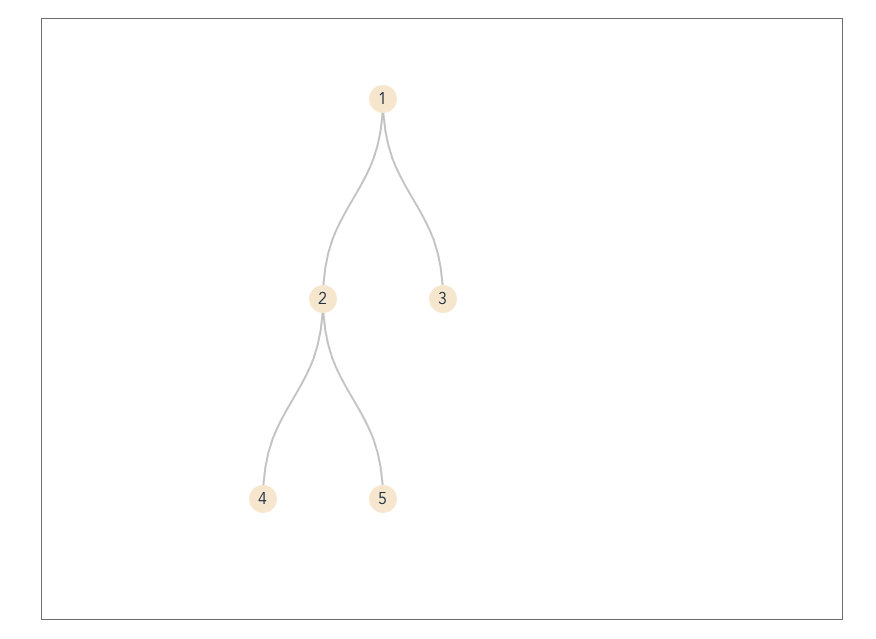
3.1 basic usage
See Code
<template>
  <div class="container">
    <vue-tree
      style="width: 800px; height: 600px; border: 1px solid gray;"
      :dataset="sampleData"
      :config="treeConfig"
    >
    </vue-tree>
  </div>
</template>

<script>
export default {
  name: 'treemap',
  data() {
    return {
      sampleData: {
        value: '1',
        children: [
          { value: '2', children: [{ value: '4' }, { value: '5' }] },
          { value: '3' }
        ]
      },
      treeConfig: { nodeWidth: 120, nodeHeight: 80, levelHeight: 200 }
    }
  }
}
</script>

<style scoped lang="less">
.container {
  display: flex;
  flex-direction: column;
  align-items: center;
}
</style>
3.2 show collapsed node in different style
See Code
<template>
  <div class="container">
    <vue-tree
      style="width: 800px; height: 600px; border: 1px solid gray;"
      :dataset="sampleData"
      :config="treeConfig"
    >
      <template v-slot:node="{ node, collapsed }">
        <span
          class="tree-node"
          :style="{ border: collapsed ? '2px solid grey' : '' }"
          >{{ node.value }}</span
        >
      </template>
    </vue-tree>
  </div>
</template>

<script>
export default {
  name: 'treemap',
  data() {
    return {
      sampleData: {
        value: '1',
        children: [
          { value: '2', children: [{ value: '4' }, { value: '5' }] },
          { value: '3' }
        ]
      },
      treeConfig: { nodeWidth: 120, nodeHeight: 80, levelHeight: 200 }
    }
  }
}
</script>

<style scoped lang="less">
.container {
  display: flex;
  flex-direction: column;
  align-items: center;
}

.tree-node {
  display: inline-block;
  width: 28px;
  height: 28px;
  border-radius: 50%;
  background-color: antiquewhite;
  text-align: center;
  line-height: 28px;
}
</style>
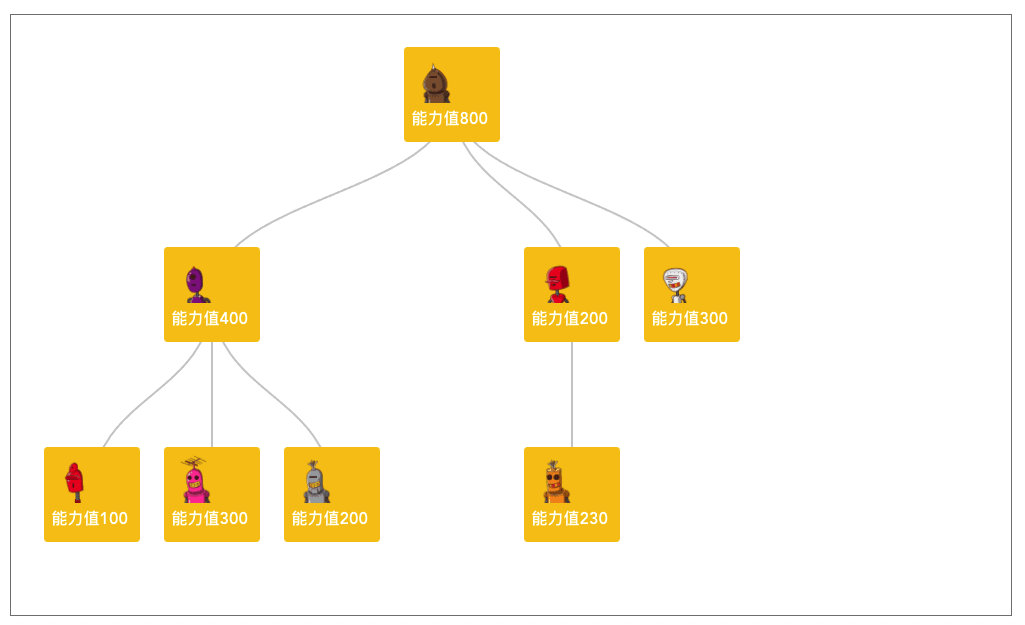
3.3 render rich media data
See Code
<template>
  <div class="container">
    <vue-tree
      style="width: 1000px; height: 600px; border: 1px solid gray;"
      :dataset="richMediaData"
      :config="treeConfig"
    >
      <template v-slot:node="{ node, collapsed }">
        <div
          class="rich-media-node"
          :style="{ border: collapsed ? '2px solid grey' : '' }"
        >
          <img
            :src="node.avatar"
            style="width: 48px; height: 48px; border-raduis: 4px;"
          />
          <span style="padding: 4px 0; font-weight: bold;"
            >能力值{{ node.value }}</span
          >
        </div>
      </template>
    </vue-tree>
  </div>
</template>

<script>
export default {
  name: 'treemap',
  data() {
    return {
      richMediaData: {
        name: 'James',
        value: 800,
        avatar:
          'https://gravatar.com/avatar/db51fdaf64d942180b5200ca37d155a4?s=400&d=robohash&r=x',
        children: [
          {
            name: 'Bob',
            value: 400,
            avatar:
              'https://gravatar.com/avatar/16b3b886b837257757c5961513396a06?s=400&d=robohash&r=x',
            children: [
              {
                name: 'C1',
                value: 100,
                avatar:
                  'https://gravatar.com/avatar/4ee8775f23f12755db978cccdc1356d9?s=400&d=robohash&r=x'
              },
              {
                name: 'C2',
                value: 300,
                avatar:
                  'https://gravatar.com/avatar/d3efa8fa639bdada96a7d0b4372e0a96?s=400&d=robohash&r=x'
              },
              {
                name: 'C3',
                value: 200,
                avatar:
                  'https://gravatar.com/avatar/4905bc3e5dc51a61e3b490ccf1891107?s=400&d=robohash&r=x'
              }
            ]
          },
          {
            name: 'Smith',
            value: 200,
            avatar:
              'https://gravatar.com/avatar/d05d081dbbb513180025300b715d5656?s=400&d=robohash&r=x',
            children: [
              {
                name: 'S1',
                value: 230,
                avatar:
                  'https://gravatar.com/avatar/60c1e69e690d943c5dc06568148debc4?s=400&d=robohash&r=x'
              }
            ]
          },
          {
            name: 'Jackson',
            value: 300,
            avatar:
              'https://gravatar.com/avatar/581f7a711c815d9671c35ebd815ec1e4?s=400&d=robohash&r=x'
          }
        ]
      },
      treeConfig: { nodeWidth: 120, nodeHeight: 80, levelHeight: 200 }
    }
  }
}
</script>

<style scoped lang="less">
.container {
  display: flex;
  flex-direction: column;
  align-items: center;
}

.rich-media-node {
  width: 80px;
  padding: 8px;
  display: flex;
  flex-direction: column;
  align-items: flex-start;
  justify-content: center;
  color: white;
  background-color: #f7c616;
  border-radius: 4px;
}
</style>
4. API
4.1 props
| type | default | description | |
|---|---|---|---|
| dataset | Object | null | nested tree data |
| config | Object | { nodeWidth: 100, nodeHeight: 100, levelHeight: 200 } |
nodeWidth and nodeHeight config the tree node size. levelHeight is tree row height |
| linkStyle | String | 'curve' | control link style, options: 'curve' or 'straight' |
| direction | string | 'vertical' | control tree chart direction, options: 'vertical' or 'horizontal' |
4.2 slot
this component only support default slot.
a sample usage like this:
<template v-slot:node="{ node, collapsed }">
  <span
    class="tree-node"
    :style="{ border: collapsed ? '2px solid grey' : '' }"
    >{{ node.value }}</span
  >
</template>
there are two slot params provided to render slot content:
| slot param | type | description |
|---|---|---|
| node | Object | current node data to be rendered |
| collapsed | Boolean | current node collapse status |
Canvas version
the canvas version is not published with npm module.
if you want to use this project's canvas version, please download the source code and edit with the following steps:
- replace the data in
/src/base/data-generator.jswith your own nested data. - add your data drawing logic in
/src/components/org-chart.js #drawShowCanvas
Build Setup
# install dependencies
npm install

# serve with hot reload at localhost
npm run dev

# build for production with minification (build to ./docs folder, which can be auto servered by github page ?)
npm run build