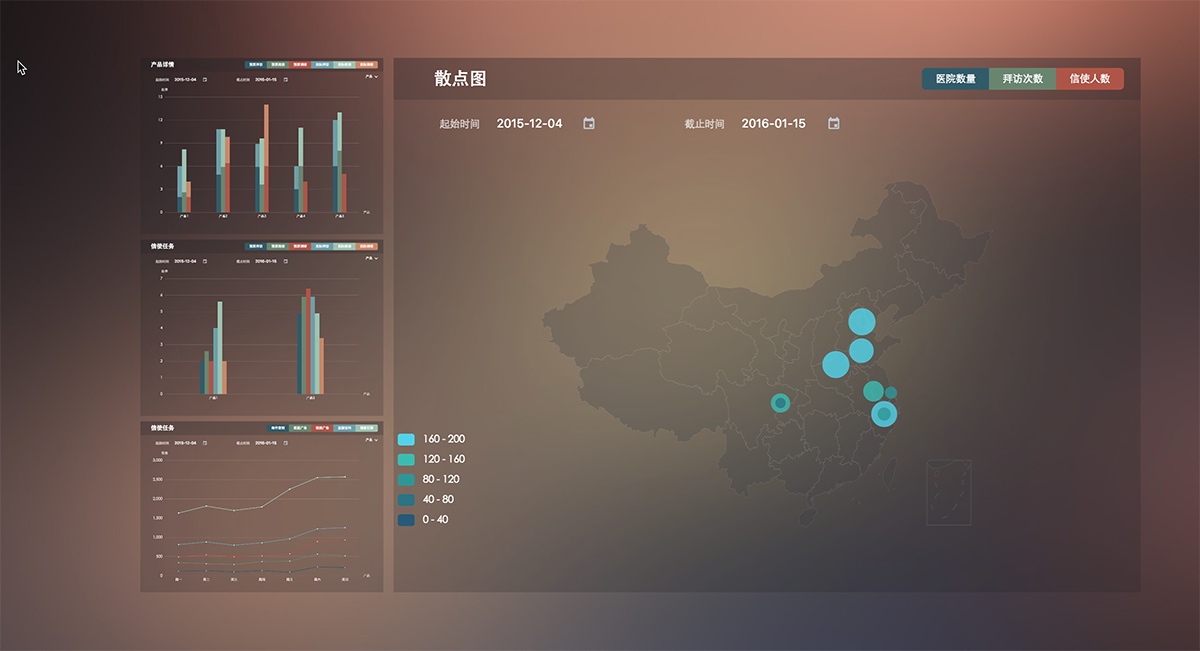
DataVisualization
by vue2.0 with echarts3.3.2
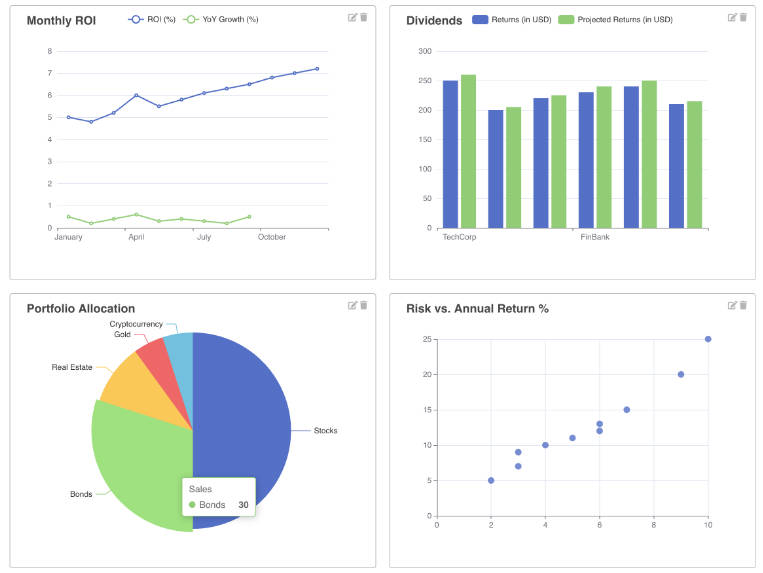
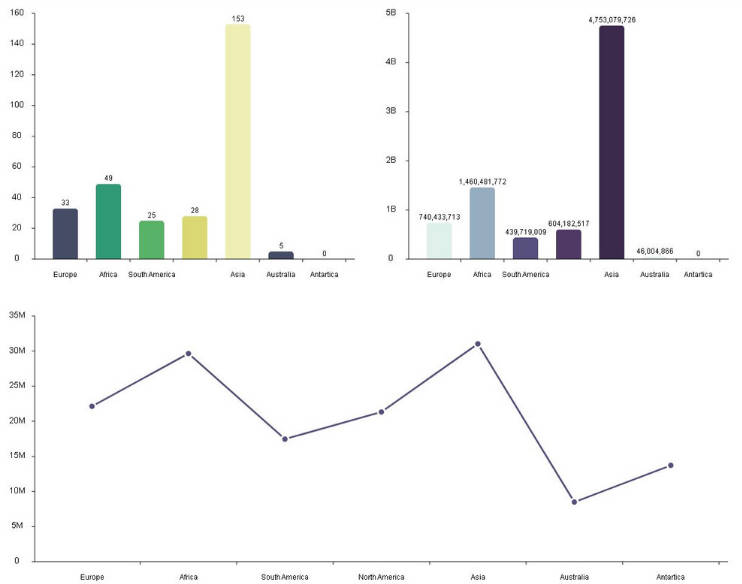
The data will be displayed in the form of charts will greatly enhance the readability and reading efficiency
This example contains histograms, line graphs, scatterplots, thermograms, complex histograms, preview panels, etc.
Live Demo
https://simonzhangiter.github.io/DataVisualization/#/dashboard