Vue-ECharts
Vue.js component for Apache ECharts.
Uses Apache ECharts 5 and works for both Vue.js 2/3.
Installation & Usage
npm & ESM
$ npm install echarts vue-echarts
To make vue-echarts work for Vue 2, you need to have @vue/composition-api installed:
npm i -D @vue/composition-api
Vue 3
import { createApp } from 'vue'
import ECharts from 'vue-echarts'
import { use } from "echarts/core"

// import ECharts modules manually to reduce bundle size
import {
  CanvasRenderer
} from 'echarts/renderers'
import {
  BarChart
} from 'echarts/charts'
import {
  GridComponent,
  TooltipComponent
} from 'echarts/components'

use([
  CanvasRenderer,
  BarChart,
  GridComponent,
  TooltipComponent
])

const app = createApp(...)

// register globally (or you can do it locally)
app.component('v-chart', ECharts)

app.mount(...)
Vue 2
import Vue from 'vue'
import ECharts from 'vue-echarts'
import { use } from 'echarts/core'

// import ECharts modules manually to reduce bundle size
import {
  CanvasRenderer
} from 'echarts/renderers'
import {
  BarChart
} from 'echarts/charts'
import {
  GridComponent,
  TooltipComponent
} from 'echarts/components'

use([
  CanvasRenderer,
  BarChart,
  GridComponent,
  TooltipComponent
]);

// register globally (or you can do it locally)
Vue.component('v-chart', ECharts)

new Vue(...)
We encourage manually importing components and charts from ECharts for smaller bundle size. See all supported renderers/charts/components here →
But if you really want to import the whole ECharts bundle without having to import modules manually, just add this in your code:
import "echarts";
SFC example
>Vue 3
<template>
<v-chart class="chart" :option="option" />
</template>
<script>
import { use } from "echarts/core";
import { CanvasRenderer } from "echarts/renderers";
import { PieChart } from "echarts/charts";
import {
TitleComponent,
TooltipComponent,
LegendComponent
} from "echarts/components";
import VChart, { THEME_KEY } from "vue-echarts";
import { ref, defineComponent } from "vue";
use([
CanvasRenderer,
PieChart,
TitleComponent,
TooltipComponent,
LegendComponent
]);
export default defineComponent({
name: "HelloWorld",
components: {
VChart
},
provide: {
[THEME_KEY]: "dark"
},
setup () {
const option = ref({
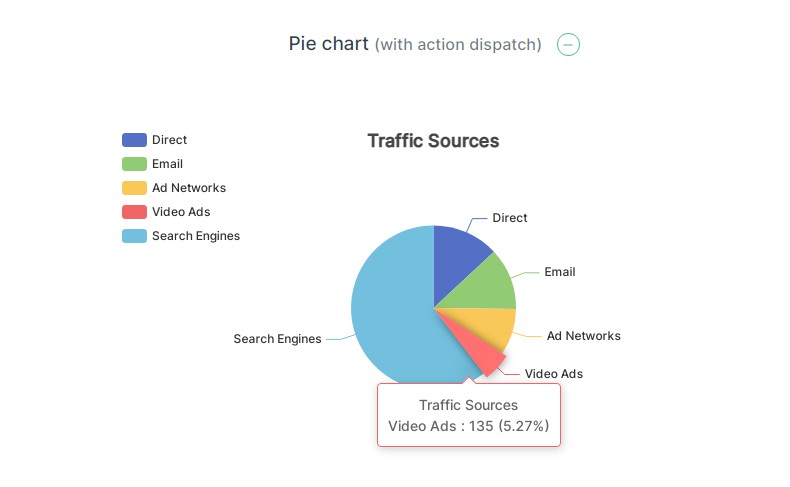
title: {
text: "Traffic Sources",
left: "center"
},
tooltip: {
trigger: "item",
formatter: "{a} <br/>{b} : {c} ({d}%)"
},
legend: {
orient: "vertical",
left: "left",
data: ["Direct", "Email", "Ad Networks", "Video Ads", "Search Engines"]
},
series: [
{
name: "Traffic Sources",
type: "pie",
radius: "55%",
center: ["50%", "60%"],
data: [
{ value: 335, name: "Direct" },
{ value: 310, name: "Email" },
{ value: 234, name: "Ad Networks" },
{ value: 135, name: "Video Ads" },
{ value: 1548, name: "Search Engines" }
],
emphasis: {
itemStyle: {
shadowBlur: 10,
shadowOffsetX: 0,
shadowColor: "rgba(0, 0, 0, 0.5)"
}
}
}
]
});
return { option };
}
});
</script>
<style scoped>
.chart {
height: 400px;
}
</style>
Vue 2
<template>
  <v-chart class="chart" :option="option" />
</template>

<script>
import { use } from "echarts/core";
import { CanvasRenderer } from "echarts/renderers";
import { PieChart } from "echarts/charts";
import {
  TitleComponent,
  TooltipComponent,
  LegendComponent
} from "echarts/components";
import VChart, { THEME_KEY } from "vue-echarts";

use([
  CanvasRenderer,
  PieChart,
  TitleComponent,
  TooltipComponent,
  LegendComponent
]);

export default {
  name: "HelloWorld",
  components: {
    VChart
  },
  provide: {
    [THEME_KEY]: "dark"
  },
  data() {
    return {
      option: {
        title: {
          text: "Traffic Sources",
          left: "center"
        },
        tooltip: {
          trigger: "item",
          formatter: "{a} <br/>{b} : {c} ({d}%)"
        },
        legend: {
          orient: "vertical",
          left: "left",
          data: [
            "Direct",
            "Email",
            "Ad Networks",
            "Video Ads",
            "Search Engines"
          ]
        },
        series: [
          {
            name: "Traffic Sources",
            type: "pie",
            radius: "55%",
            center: ["50%", "60%"],
            data: [
              { value: 335, name: "Direct" },
              { value: 310, name: "Email" },
              { value: 234, name: "Ad Networks" },
              { value: 135, name: "Video Ads" },
              { value: 1548, name: "Search Engines" }
            ],
            emphasis: {
              itemStyle: {
                shadowBlur: 10,
                shadowOffsetX: 0,
                shadowColor: "rgba(0, 0, 0, 0.5)"
              }
            }
          }
        ]
      }
    };
  }
};
</script>

<style scoped>
.chart {
  height: 400px;
}
</style>
CDN & Global variable
Drop <script> inside your HTML file and access the component via window.VueECharts.
Vue 3
<script src="https://cdn.jsdelivr.net/npm/[email protected]"></script>
<script src="https://cdn.jsdelivr.net/npm/[email protected]"></script>
<script src="https://cdn.jsdelivr.net/npm/[email protected]"></script>


```js
const app = Vue.createApp(...)

// register globally (or you can do it locally)
app.component('v-chart', VueECharts)
Vue 2
<script src="https://cdn.jsdelivr.net/npm/[email protected]"></script>
<script src="https://cdn.jsdelivr.net/npm/@vue/[email protected]"></script>
<script src="https://cdn.jsdelivr.net/npm/[email protected]"></script>
<script src="https://cdn.jsdelivr.net/npm/[email protected]"></script>
// register globally (or you can do it locally)
Vue.component("v-chart", VueECharts);
See more examples here.
Props
-
init-options: objectOptional chart init configurations. See
echarts.init'soptsparameter here →Injection key:
INIT_OPTIONS_KEY. -
theme: string | objectTheme to be applied. See
echarts.init'sthemeparameter here →Injection key:
THEME_KEY. -
option: objectECharts' universal interface. Modifying this prop will trigger ECharts'
setOptionmethod. Read more here → -
update-options: objectOptions for updating chart option. See
echartsInstance.setOption'soptsparameter here →Injection key:
UPDATE_OPTIONS_KEY. -
group: stringGroup name to be used in chart connection. See
echartsInstance.grouphere → -
autoresize: boolean(default:false)Whether the chart should be resized automatically whenever its root is resized.
-
loading: boolean(default:false)Whether the chart is in loading state.
-
loading-options: objectConfiguration item of loading animation. See
echartsInstance.showLoading'soptsparameter here →Injection key:
LOADING_OPTIONS_KEY. -
manual-update: boolean(default:false)For performance critical scenarios (having a large dataset) we'd better bypass Vue's reactivity system for
optionprop. By specifyingmanual-updateprop withtrueand not providingoptionprop, the dataset won't be watched any more. After doing so, you need to retrieve the component instance withrefand manually callsetOptionmethod to update the chart.
Provide / Inject
Vue-ECharts provides provide/inject API for theme, init-options, update-options and loading-options to help configuring contextual options. eg. for init-options you can use the provide API like this:
Vue 3
import { INIT_OPTIONS_KEY } from 'vue-echarts'
import { provide } from 'vue'

// composition API
provide(INIT_OPTIONS_KEY, ...)

// options API
{
  provide: {
    [INIT_OPTIONS_KEY]: { ... }
  }
}
Vue 2
import { INIT_OPTIONS_KEY } from 'vue-echarts'

// in component options
{
  provide: {
    [INIT_OPTIONS_KEY]: { ... }
  }
}