Pure Vue Chart
A simple and lightweight vue component for making charts that do not rely on large chart libraries and will not bloat your dependencies.
Example
<pure-vue-chart
  :points="[3,5,2,5,4]"
  :width="400"
  :height="200"
/>
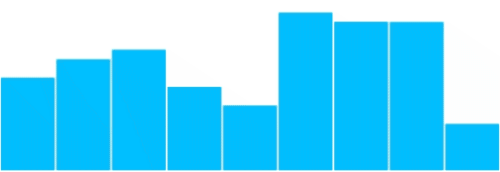
When props are updated the graph will automatically animate to the new values.
Install
npm i pure-vue-chart
Import it:
import PureVueChart from 'pure-vue-chart';
Register it in your component:
components: {
    PureVueChart,
},
Use it
<pure-vue-chart
  :points="[3,5,2,5,4]"
  :width="400"
  :height="200"
/>
Options
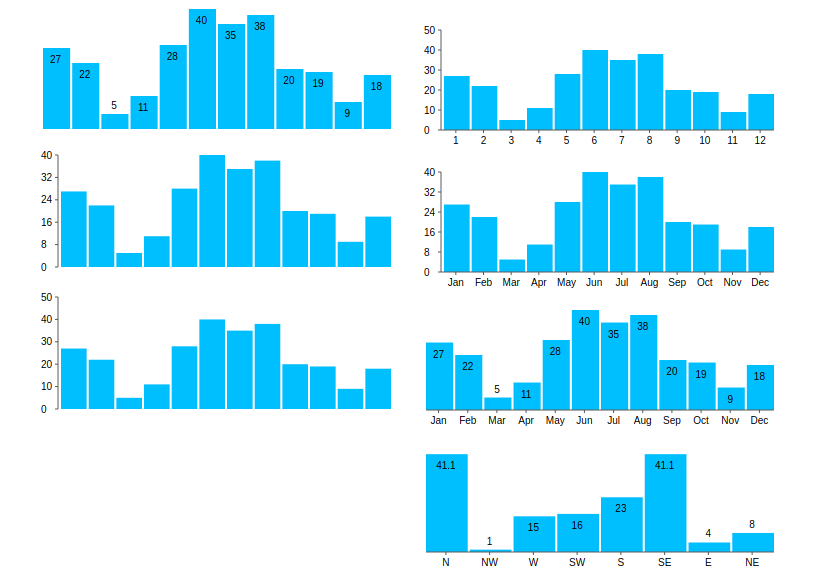
To further control the display of data, you can use simple props to manipulate the charts. Here are some examples:
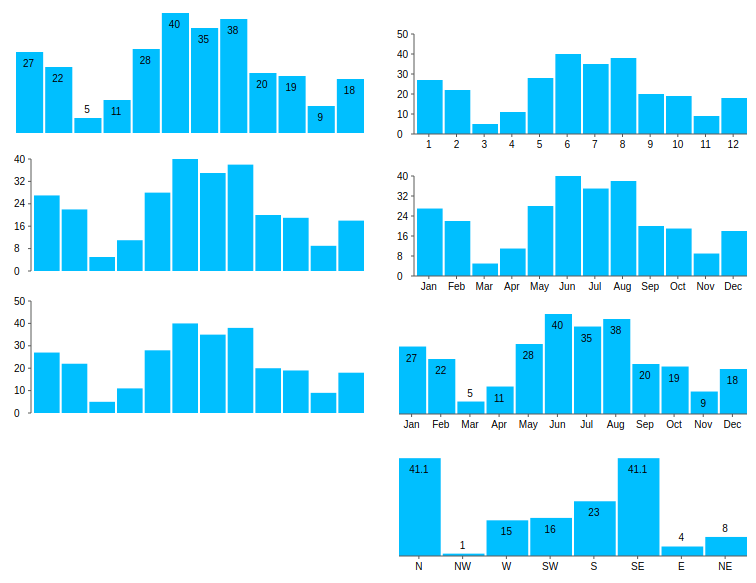
Most of the available props below are self-explanatory:
:points=[1,4,5,3,4]
:show-y-axis="false"
:show-x-axis="true"
:width="400"
:height="200"
:show-values="true"
:use-month-labels="true"
:months="['Jan', 'Fev', 'Mar', 'Abr', 'Mai', 'Jun', 'Jul', 'Ago', 'Set', 'Out', 'Nov', 'Dez']"
Additional Features:
Trendline
You can add a simple linear trend line by using the following props:
:show-trend-line="true"
:trend-line-width="2"
trend-line-color="lightblue"

X-axis labels:
X-axis labels, by default will be from 1 - length-of-data.
But you can automatically use Months by using the prop :use-month-labels="true".
Or you can provide the data as an array of objects, each with a value and label like so:
:points=[{label: 'N', value: 41.1}, {label: 'NW', value: 1}, {label: 'W', value: 15}]
Contributing
I'm open to any issues or pull requests so long as they are simple, easy to read, use the eslint settings in package.json, and follow commitizen-esque style commit formats. Just open an issue on github and start a discussion. - pure-vue-chart issues - https://github.com/djaxho/pure-vue-chart/issuesAuthors or Acknowledgments
- Danny Jackson
List of features
- Simple bar charts
- Line charts (planned)
- Pie charts (planned)
- Rose charts (planned)