Multidimensional Chart
Introduction
This is my personal project for graduating from university.
It is a simple tool that can help plot charts and analyse data. It has the following functions.
- Import files, lile
.xls、.xlsx、.csv、.json. - Infer data type automatically.
- Calculate general statistical values.
- Fill empty values.
- Draw a chart by dragging and dropping labels.
- Switch themes.
- ……
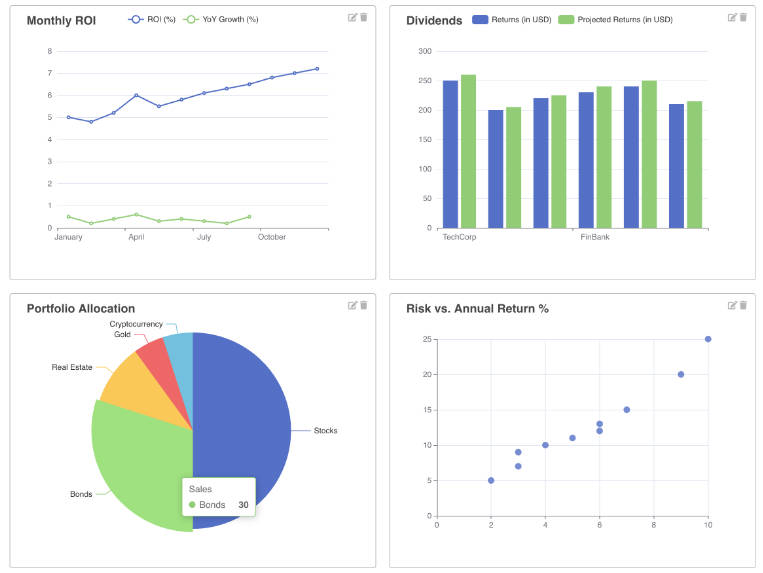
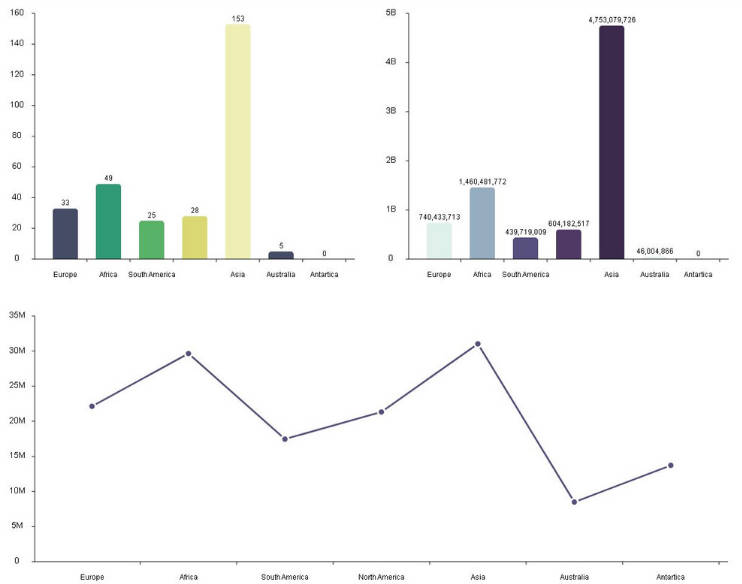
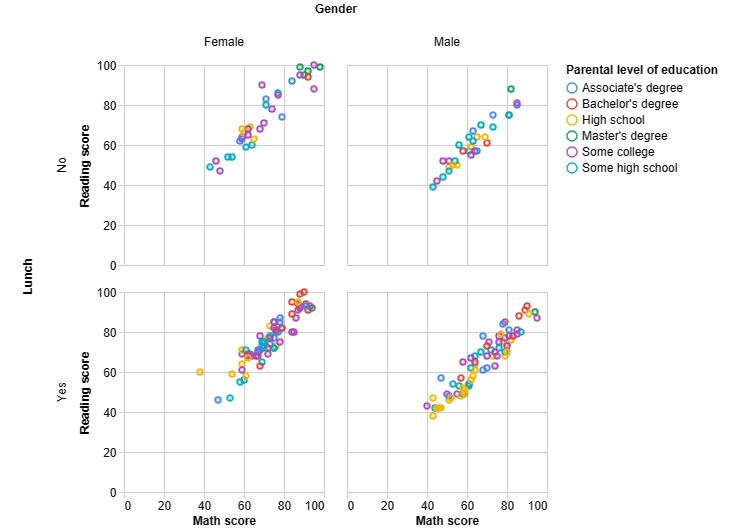
Examples
DataTable

SketchPad

Chart1

Chart2

Chart3