Vue3-Charts
Vue3-Charts is a SVG-based charting library that is very easy to use and highly customizable.
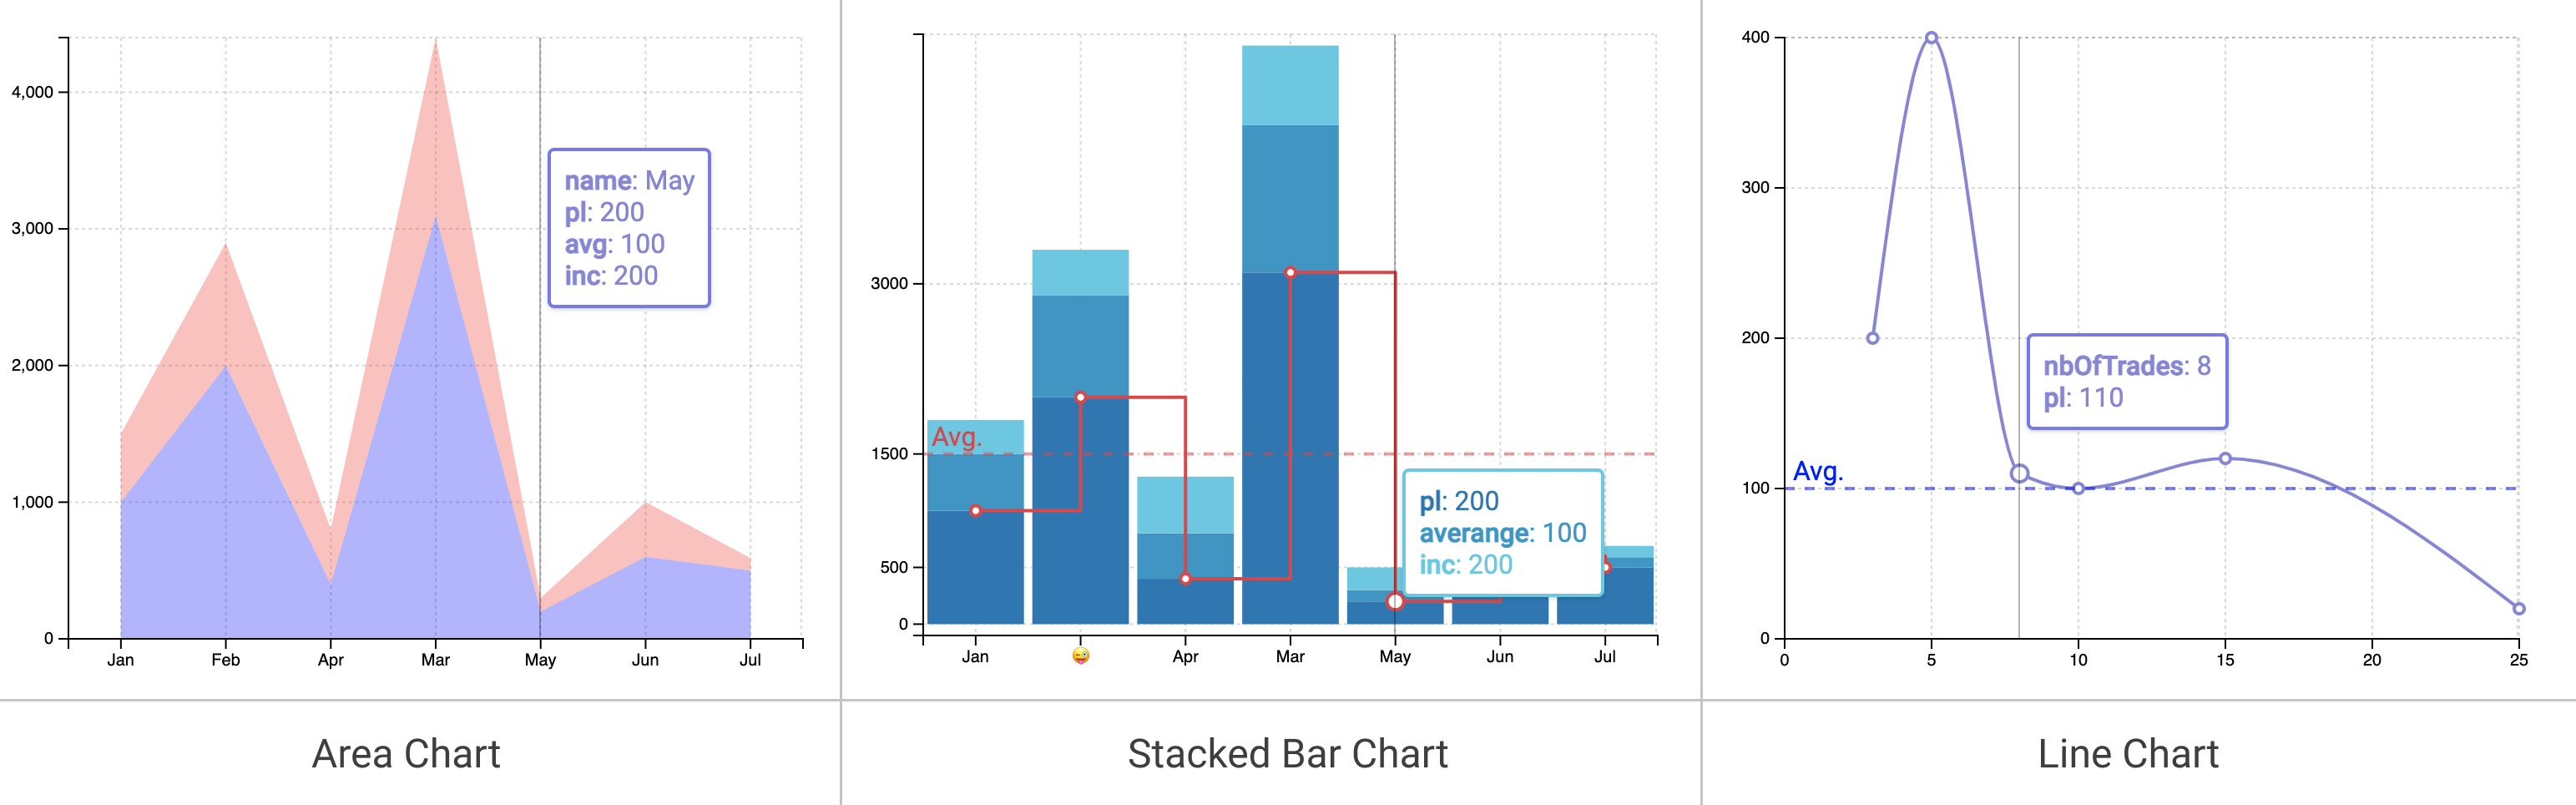
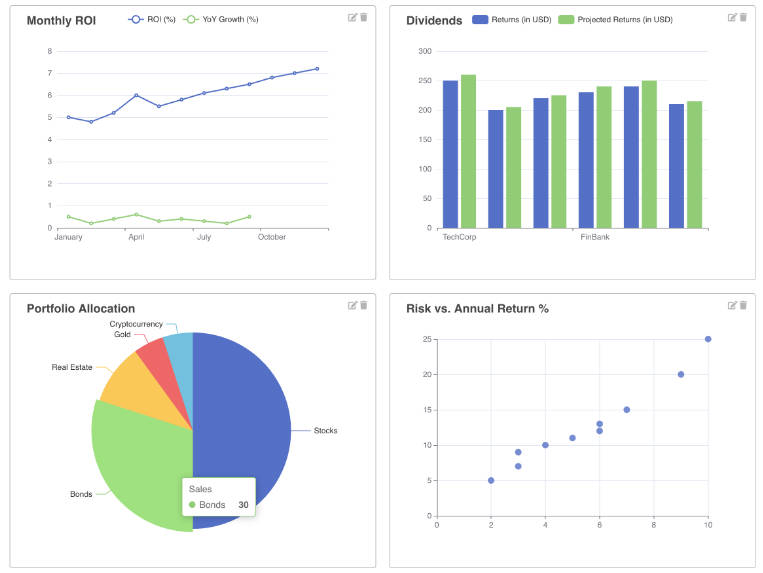
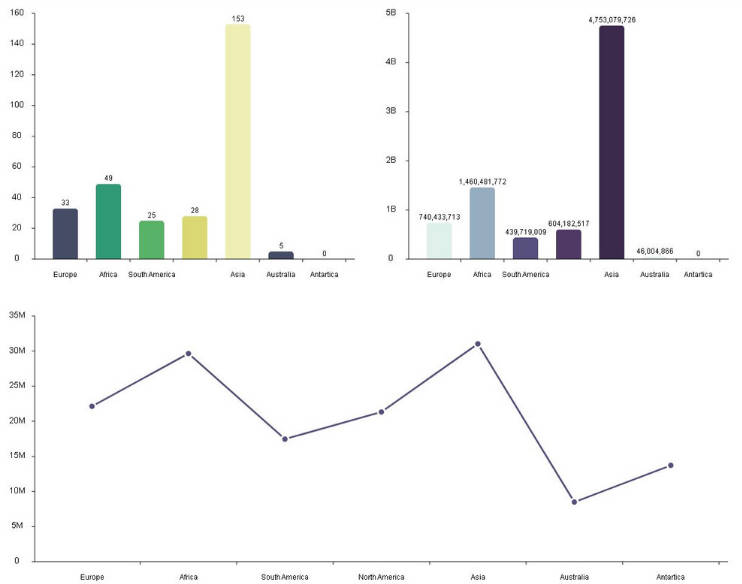
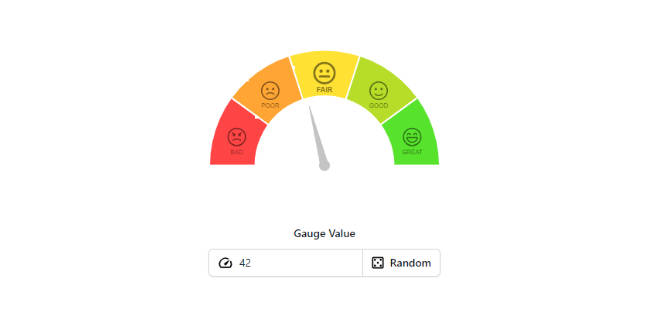
Data visualization in Vue3 made easy
- ? Intuitive
- ? Extensible
- ? Extremely easy to use
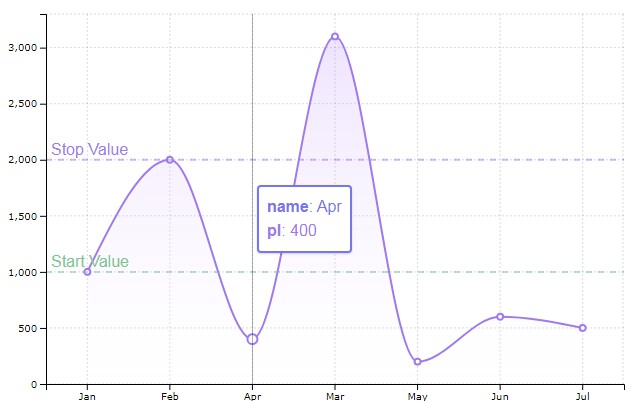
Here is a basic example:
<div>
  <Chart :data="data" :margin="margin" :direction="direction">
    <template #layers>
      <Grid strokeDasharray="2,2" />
      <Bar :dataKeys="['name', 'pl']" :barStyle="{ fill: '#90e0ef' }" />
      <Bar :dataKeys="['name', 'avg']" :barStyle="{ fill: '#0096c7' }" />
      <Line :dataKeys="['name', 'avg']" type="step" />
    </template>
  </Chart>
</div>
<script>
import { defineComponent } from 'vue'
import { plByMonth } from '@/data'
import { Chart, Grid, Bar, Line } from 'vue3-charts'

export default defineComponent({
  name: 'Main',
  components: { Chart, Grid, Bar, Line },
  setup() {
    const data = ref(plByMonth)

    const direction = ref('horizontal')
    const margin = ref({
      left: 0,
      top: 20,
      right: 20,
      bottom: 0
    })

    return {data, margin, direction}
  }
})
</script>
Components List
This project is still in early development. New charts will be added regularly.
- [x] Line Chart
- [x] Area Chart
- [x] Stacked Area Chart
- [x] Column Chart
- [x] Stacked Column Chart
- [x] Bar Chart
- [x] Stacked Bar Chart
- [ ] Scatter Plot
- [ ] Treemap