Vue Datamaps
It is a Vue port of the javascript-based DataMaps
Run Demo
$ git clone https://github.com/Seungwoo321/vue-datamaps.git
$ cd vue-datamaps/demo/example-vue-cli3/
$ npm install
$ npm run serve
Installation
$ npm install -D vue-datamaps
Base Usage
Required
- The json data must be in a public directory.
Global
main.js
import Vue from 'vue'
import VueDatamaps from 'vue-datamaps'

Vue.use(VueDatamaps)
vue template
<template>
    <div id="app">
        <vue-datamaps></vue-datamaps>
    </div>
</template>
Component Style
vue template
<template>
    <div id="app">
        <vue-datamaps></vue-datamaps>
    </div>
</template>
<script>
import { VueDatamaps } from 'vue-datamaps'
export default {
    components: {
        VueDatamaps
    }
}
</script>
<style>
</style>
Example
<template>
  <div>
    <h4>Basic:</h4>
    <vue-datamaps/>
  </div>
</template>

<script>
import { VueDatamaps } from 'vue-datamaps'
export default {
  components: {
    VueDatamaps
  }
}
</script>

<style>

</style>
<template>
<div>
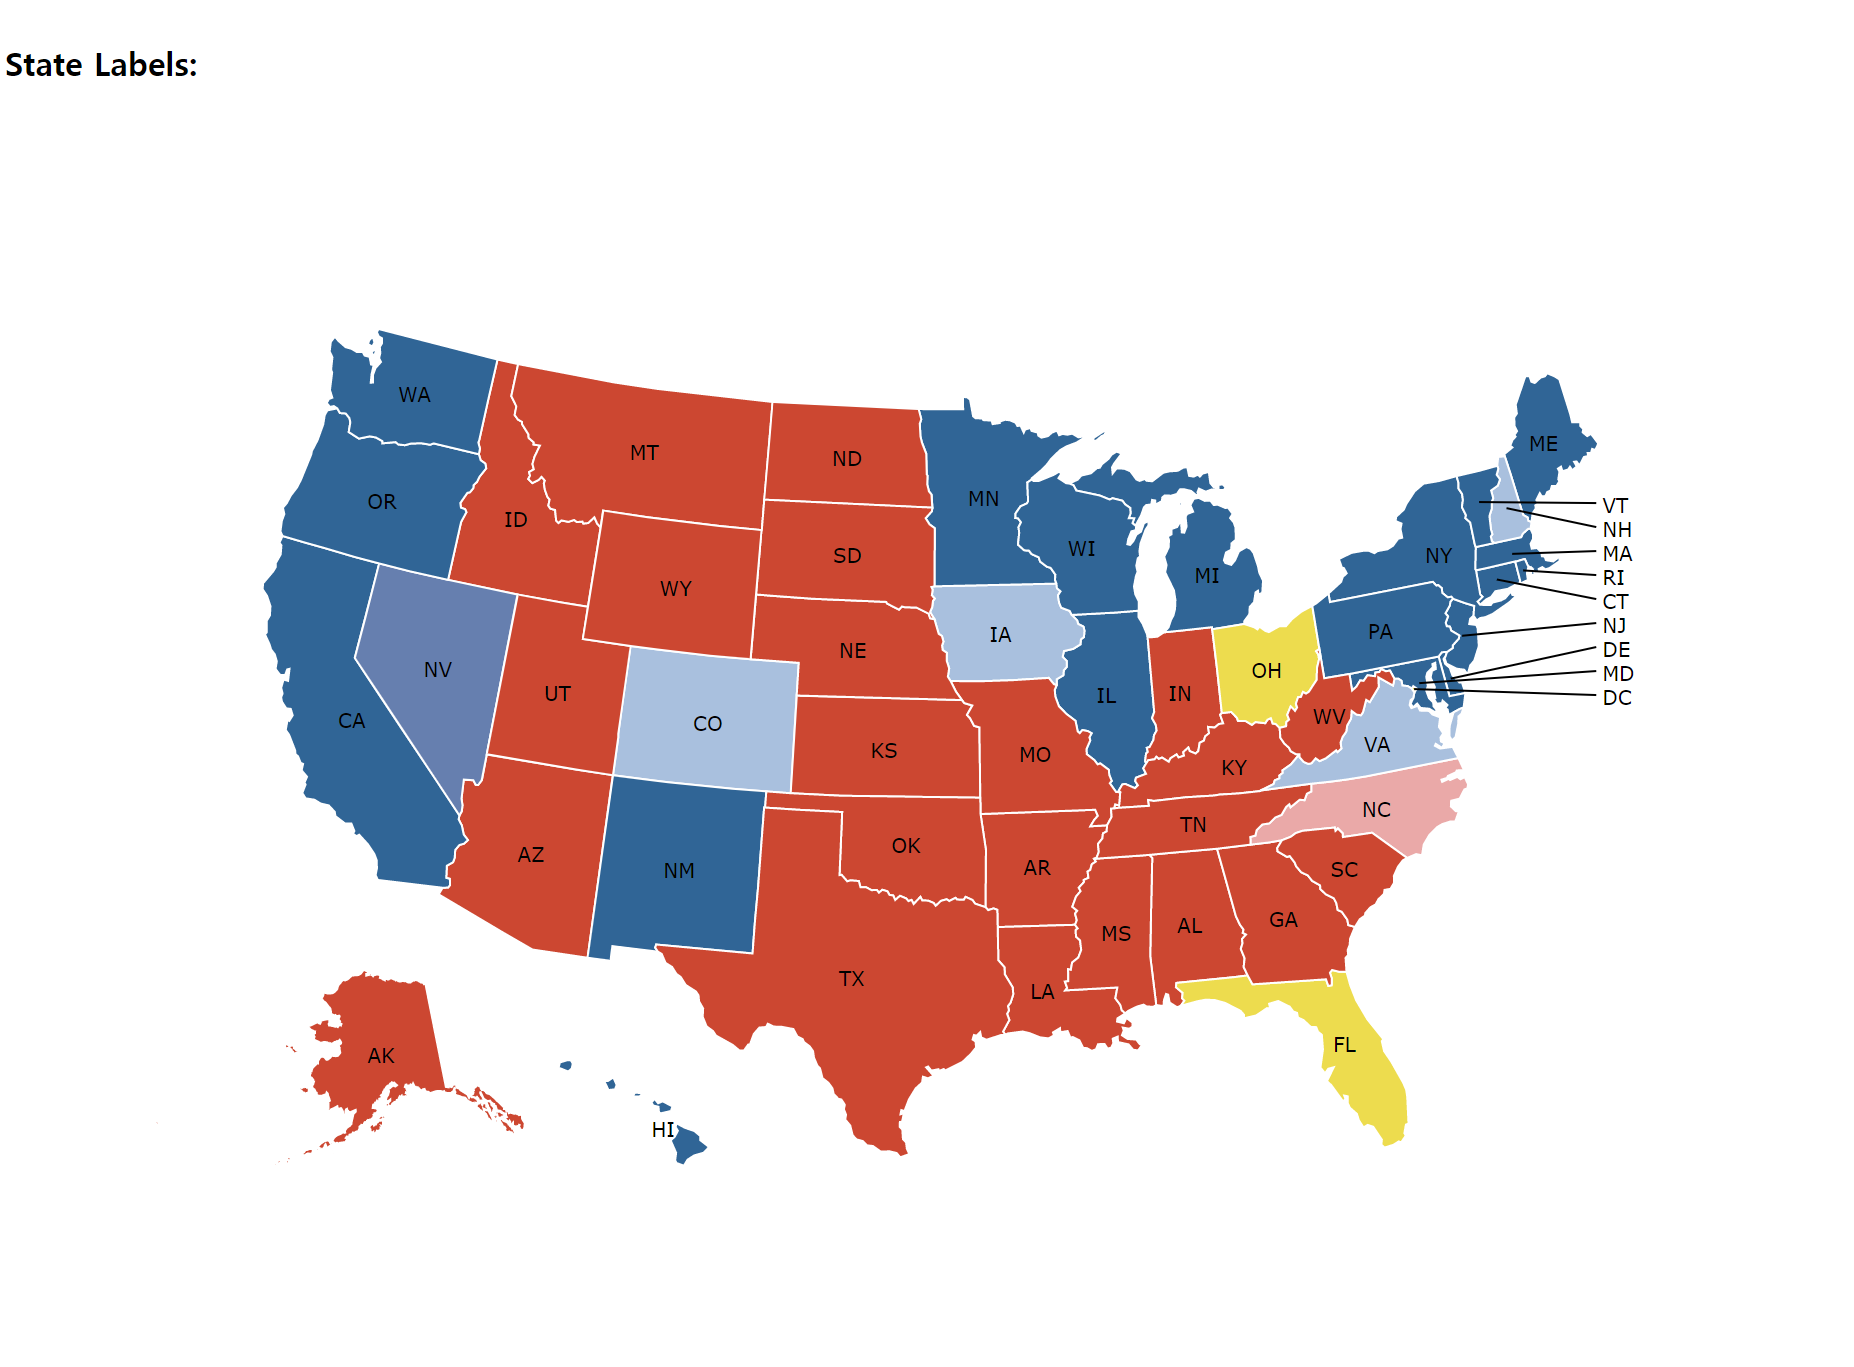
<h4>State Labels:</h4>
<vue-datamaps
labels
:scope="scope"
:geographyConfig="geographyConfig"
:fills="fills"
:data="data"
popupTemplate
@custom:popup="popupTemplate"
>
<div slot="hoverinfo" class="hoverinfo" style="white-space: pre-line;">
{{ popupData }}
</div>
</vue-datamaps>
</div>
</template>
<script>
import { VueDatamaps } from 'vue-datamaps'
export default {
components: {
VueDatamaps
},
data () {
return {
scope: 'usa',
geographyConfig: {
highlightBorderColor: '#bada55',
highlightBorderWidth: 3
},
fills: {
'Republican': '#CC4731',
'Democrat': '#306596',
'Heavy Democrat': '#667FAF',
'Light Democrat': '#A9C0DE',
'Heavy Republican': '#CA5E5B',
'Light Republican': '#EAA9A8',
defaultFill: '#EDDC4E'
},
data: {
'AZ': {
'fillKey': 'Republican',
'electoralVotes': 5
},
'CO': {
'fillKey': 'Light Democrat',
'electoralVotes': 5
},
'DE': {
'fillKey': 'Democrat',
'electoralVotes': 32
},
'FL': {
'fillKey': 'UNDECIDED',
'electoralVotes': 29
},
'GA': {
'fillKey': 'Republican',
'electoralVotes': 32
},
'HI': {
'fillKey': 'Democrat',
'electoralVotes': 32
},
'ID': {
'fillKey': 'Republican',
'electoralVotes': 32
},
'IL': {
'fillKey': 'Democrat',
'electoralVotes': 32
},
'IN': {
'fillKey': 'Republican',
'electoralVotes': 11
},
'IA': {
'fillKey': 'Light Democrat',
'electoralVotes': 11
},
'KS': {
'fillKey': 'Republican',
'electoralVotes': 32
},
'KY': {
'fillKey': 'Republican',
'electoralVotes': 32
},
'LA': {
'fillKey': 'Republican',
'electoralVotes': 32
},
'MD': {
'fillKey': 'Democrat',
'electoralVotes': 32
},
'ME': {
'fillKey': 'Democrat',
'electoralVotes': 32
},
'MA': {
'fillKey': 'Democrat',
'electoralVotes': 32
},
'MN': {
'fillKey': 'Democrat',
'electoralVotes': 32
},
'MI': {
'fillKey': 'Democrat',
'electoralVotes': 32
},
'MS': {
'fillKey': 'Republican',
'electoralVotes': 32
},
'MO': {
'fillKey': 'Republican',
'electoralVotes': 13
},
'MT': {
'fillKey': 'Republican',
'electoralVotes': 32
},
'NC': {
'fillKey': 'Light Republican',
'electoralVotes': 32
},
'NE': {
'fillKey': 'Republican',
'electoralVotes': 32
},
'NV': {
'fillKey': 'Heavy Democrat',
'electoralVotes': 32
},
'NH': {
'fillKey': 'Light Democrat',
'electoralVotes': 32
},
'NJ': {
'fillKey': 'Democrat',
'electoralVotes': 32
},
'NY': {
'fillKey': 'Democrat',
'electoralVotes': 32
},
'ND': {
'fillKey': 'Republican',
'electoralVotes': 32
},
'NM': {
'fillKey': 'Democrat',
'electoralVotes': 32
},
'OH': {
'fillKey': 'UNDECIDED',
'electoralVotes': 32
},
'OK': {
'fillKey': 'Republican',
'electoralVotes': 32
},
'OR': {
'fillKey': 'Democrat',
'electoralVotes': 32
},
'PA': {
'fillKey': 'Democrat',
'electoralVotes': 32
},
'RI': {
'fillKey': 'Democrat',
'electoralVotes': 32
},
'SC': {
'fillKey': 'Republican',
'electoralVotes': 32
},
'SD': {
'fillKey': 'Republican',
'electoralVotes': 32
},
'TN': {
'fillKey': 'Republican',
'electoralVotes': 32
},
'TX': {
'fillKey': 'Republican',
'electoralVotes': 32
},
'UT': {
'fillKey': 'Republican',
'electoralVotes': 32
},
'WI': {
'fillKey': 'Democrat',
'electoralVotes': 32
},
'VA': {
'fillKey': 'Light Democrat',
'electoralVotes': 32
},
'VT': {
'fillKey': 'Democrat',
'electoralVotes': 32
},
'WA': {
'fillKey': 'Democrat',
'electoralVotes': 32
},
'WV': {
'fillKey': 'Republican',
'electoralVotes': 32
},
'WY': {
'fillKey': 'Republican',
'electoralVotes': 32
},
'CA': {
'fillKey': 'Democrat',
'electoralVotes': 32
},
'CT': {
'fillKey': 'Democrat',
'electoralVotes': 32
},
'AK': {
'fillKey': 'Republican',
'electoralVotes': 32
},
'AR': {
'fillKey': 'Republican',
'electoralVotes': 32
},
'AL': {
'fillKey': 'Republican',
'electoralVotes': 32
}
},
popupData: ''
}
},
methods: {
popupTemplate ({ geography, datum }) {
this.popupData = `${geography.properties.name}\nElectoral Votes: ${datum.electoralVotes}`
}
}
}
</script>
<style>
</style>
<template>
<div>
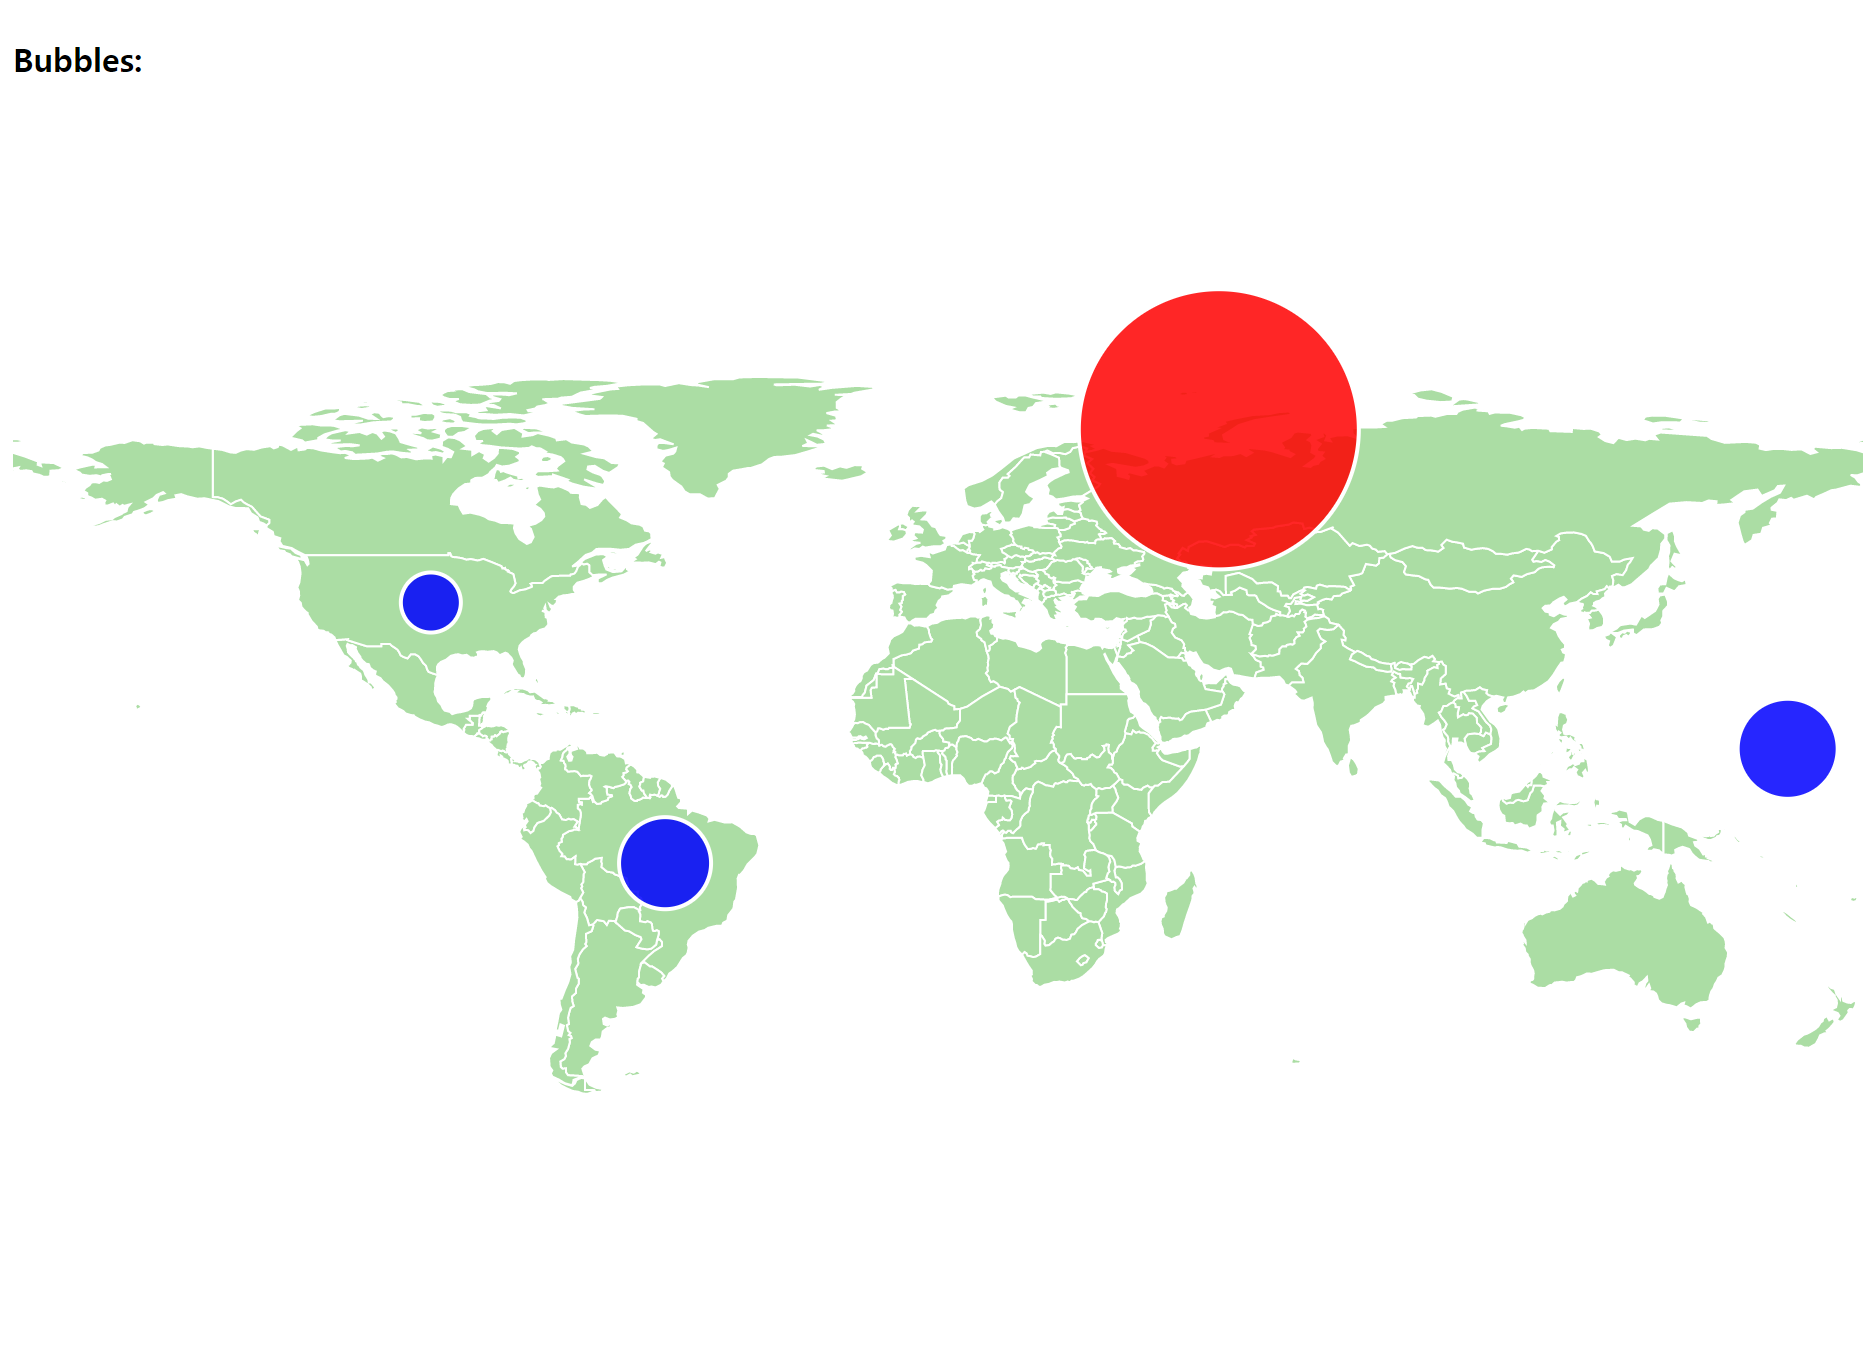
<h4>Bubbles:</h4>
<vue-datamaps
:geographyConfig="geographyConfig"
:bubblesConfig="bubblesConfig"
:fills="fills"
@custom:popup-bubble="popupTemplate"
bubbles
>
<div slot="hoverBubbleInfo" class="hoverinfo" style="text-align:center;">
<b>Yield</b>: {{ popupData.yeild }}<br>
Exploded on {{ popupData.date }} by the {{ popupData.country }}
</div>
</vue-datamaps>
</div>
</template>
<script>
import { VueDatamaps } from 'vue-datamaps'
export default {
components: {
VueDatamaps
},
data () {
return {
geographyConfig: {
popupOnHover: true,
highlightOnHover: true
},
fills: {
defaultFill: '#ABDDA4',
USA: 'blue',
RUS: 'red'
},
bubblesConfig: {
popupTemplate: true,
data: [
{
name: 'Not a bomb, but centered on Brazil',
radius: 23,
centered: 'BRA',
country: 'USA',
yeild: 0,
fillKey: 'USA',
date: '1954-03-01'
},
{
name: 'Not a bomb',
radius: 15,
yeild: 0,
country: 'USA',
centered: 'USA',
date: '1986-06-05',
significance: 'Centered on US',
fillKey: 'USA'
},
{
name: 'Castle Bravo',
radius: 25,
yeild: 15000,
country: 'USA',
significance: 'First dry fusion fuel "staged" thermonuclear weapon; a serious nuclear fallout accident occurred',
fillKey: 'USA',
date: '1954-03-01',
latitude: 11.415,
longitude: 165.1619
}, {
name: 'Tsar Bomba',
radius: 70,
yeild: 50000,
country: 'USSR',
fillKey: 'RUS',
significance: 'Largest thermonuclear weapon ever tested—scaled down from its initial 100 Mt design by 50%',
date: '1961-10-31',
latitude: 73.482,
longitude: 54.5854
}
]
},
popupData: {
yeild: '',
date: '',
country: ''
}
}
},
methods: {
popupTemplate ({ datum }) {
this.popupData = {
yeild: datum.yeild,
date: datum.date,
country: datum.country
}
}
}
}
</script>
<style>
</style>
<template>
<div>
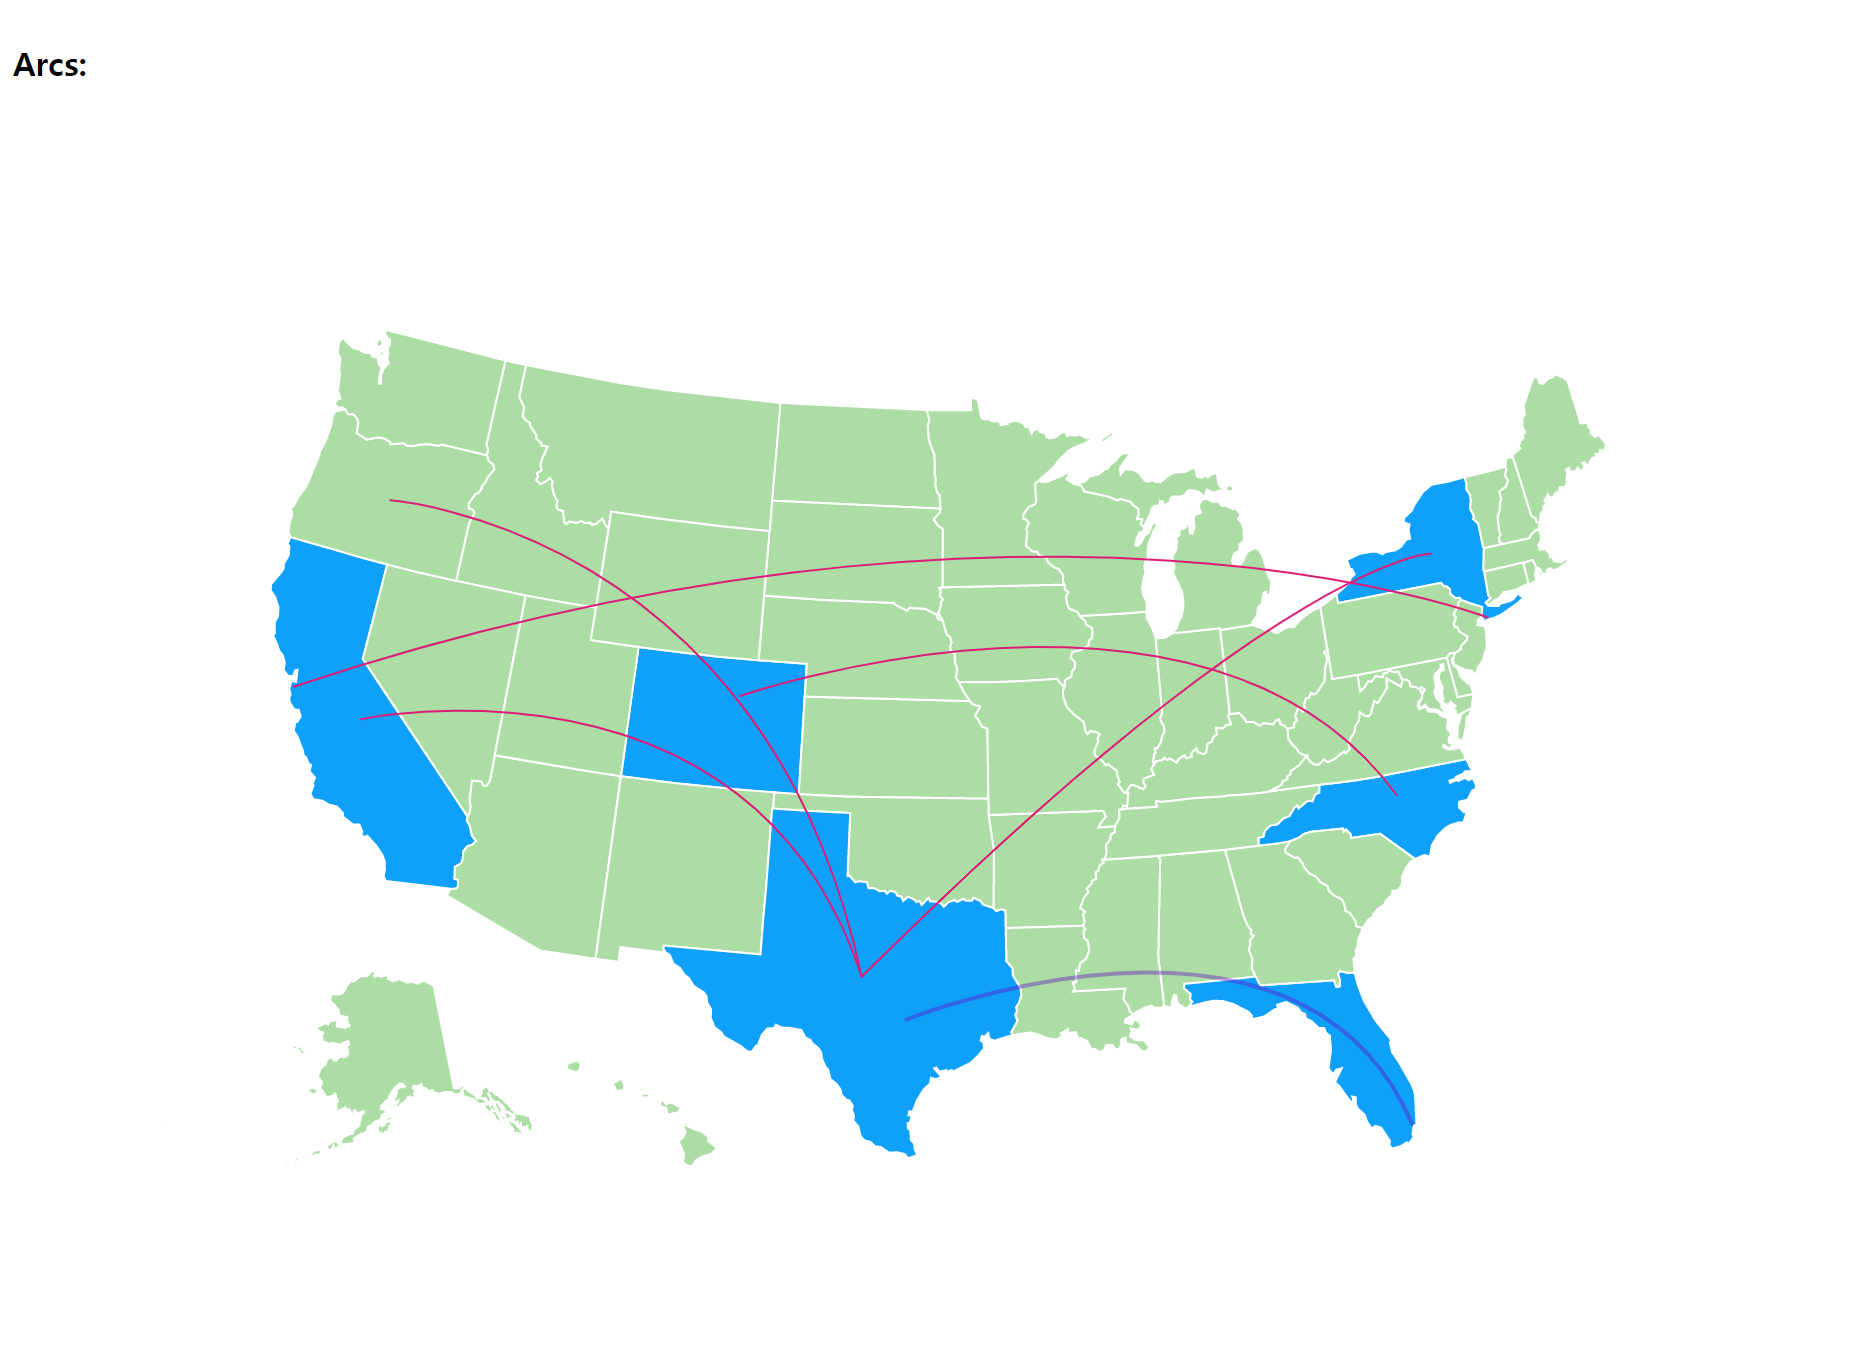
<h4>Arcs:</h4>
<vue-datamaps
:scope="scope"
:fills="fills"
:data="data"
:geographyConfig="geographyConfig"
:arcConfig="arcConfig"
arc
/>
</div>
</template>
<script>
import { VueDatamaps } from 'vue-datamaps'
export default {
components: {
VueDatamaps
},
data () {
return {
geographyConfig: {
popupOnHover: true,
highlightOnHover: true
},
scope: 'usa',
fills: {
defaultFill: '#ABDDA4',
win: '#0fa0fa'
},
data: {
'TX': { fillKey: 'win' },
'FL': { fillKey: 'win' },
'NC': { fillKey: 'win' },
'CA': { fillKey: 'win' },
'NY': { fillKey: 'win' },
'CO': { fillKey: 'win' }
},
arcConfig: {
popupOnHover: true,
data: [
{
origin: 'CA',
destination: 'TX'
},
{
origin: 'OR',
destination: 'TX'
},
{
origin: 'NY',
destination: 'TX'
},
{
origin: {
latitude: 40.639722,
longitude: -73.778889
},
destination: {
latitude: 37.618889,
longitude: -122.375
}
},
{
origin: {
latitude: 30.194444,
longitude: -97.67
},
destination: {
latitude: 25.793333,
longitude: -80.290556
},
options: {
strokeWidth: 2,
strokeColor: 'rgba(100, 10, 200, 0.4)',
greatArc: true
}
},
{
origin: {
latitude: 39.861667,
longitude: -104.673056
},
destination: {
latitude: 35.877778,
longitude: -78.7875
}
}
],
strokeWidth: 1,
arcSharpness: 1.4
}
}
}
}
</script>
<style>
</style>
<template>
<div>
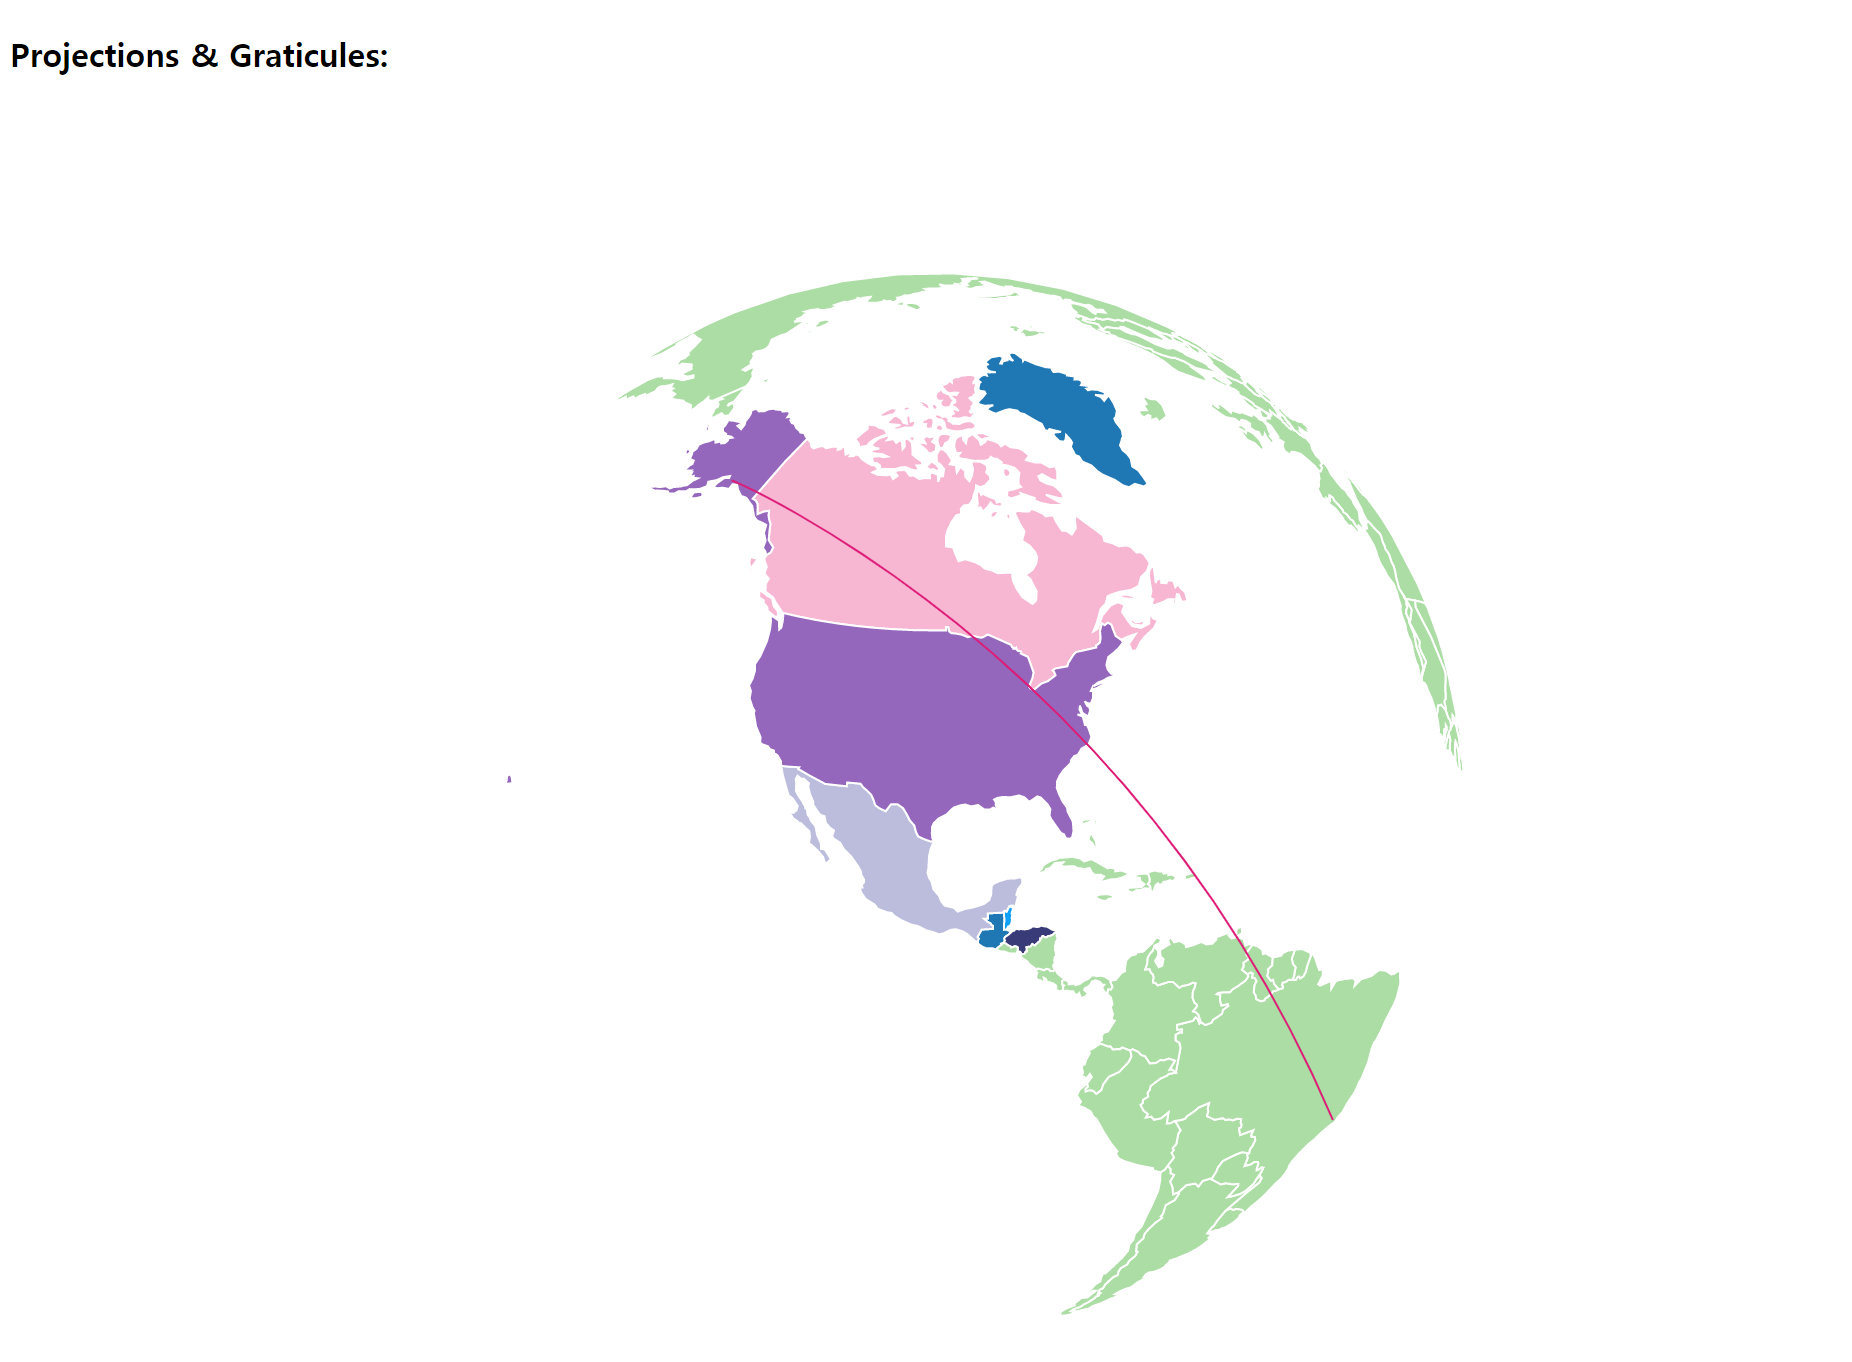
<h4>Projections & Graticules:</h4>
<vue-datamaps
:scope="scope"
:projection="projection"
:projectionConfig="projectionConfig"
:fills="fills"
:data="data"
:arcConfig="arcConfig"
arc
/>
</div>
</template>
<script>
import { VueDatamaps } from 'vue-datamaps'
import * as d3 from 'd3v4'
export default {
components: {
VueDatamaps
},
data () {
return {
scope: 'world',
projection: 'Orthographic',
fills: {
defaultFill: '#ABDDA4',
gt50: d3.schemeCategory20[Math.floor(Math.random() * 20)],
eq50: d3.schemeCategory20b[Math.floor(Math.random() * 20)],
lt25: d3.schemeCategory20c[Math.floor(Math.random() * 20)],
gt75: d3.schemeCategory20[Math.floor(Math.random() * 20)],
lt50: d3.schemeCategory10[Math.floor(Math.random() * 10)],
eq0: d3.schemeCategory10[Math.floor(Math.random() * 1)],
pink: '#0fa0fa',
gt500: d3.schemeCategory10[Math.floor(Math.random() * 1)]
},
data: {
'USA': { fillKey: 'lt50' },
'MEX': { fillKey: 'lt25' },
'CAN': { fillKey: 'gt50' },
'GTM': { fillKey: 'gt500' },
'HND': { fillKey: 'eq50' },
'BLZ': { fillKey: 'pink' },
'GRL': { fillKey: 'eq0' }
},
projectionConfig: {
rotation: [97, -30]
},
arcConfig: {
popupOnHover: false,
data: [
{
origin: {
latitude: 61,
longitude: -149
},
destination: {
latitude: -22,
longitude: -43
}
}
],
greatArc: true,
animationSpeed: 2000
}
}
}
}
</script>
<style>
</style>
<template>
<div>
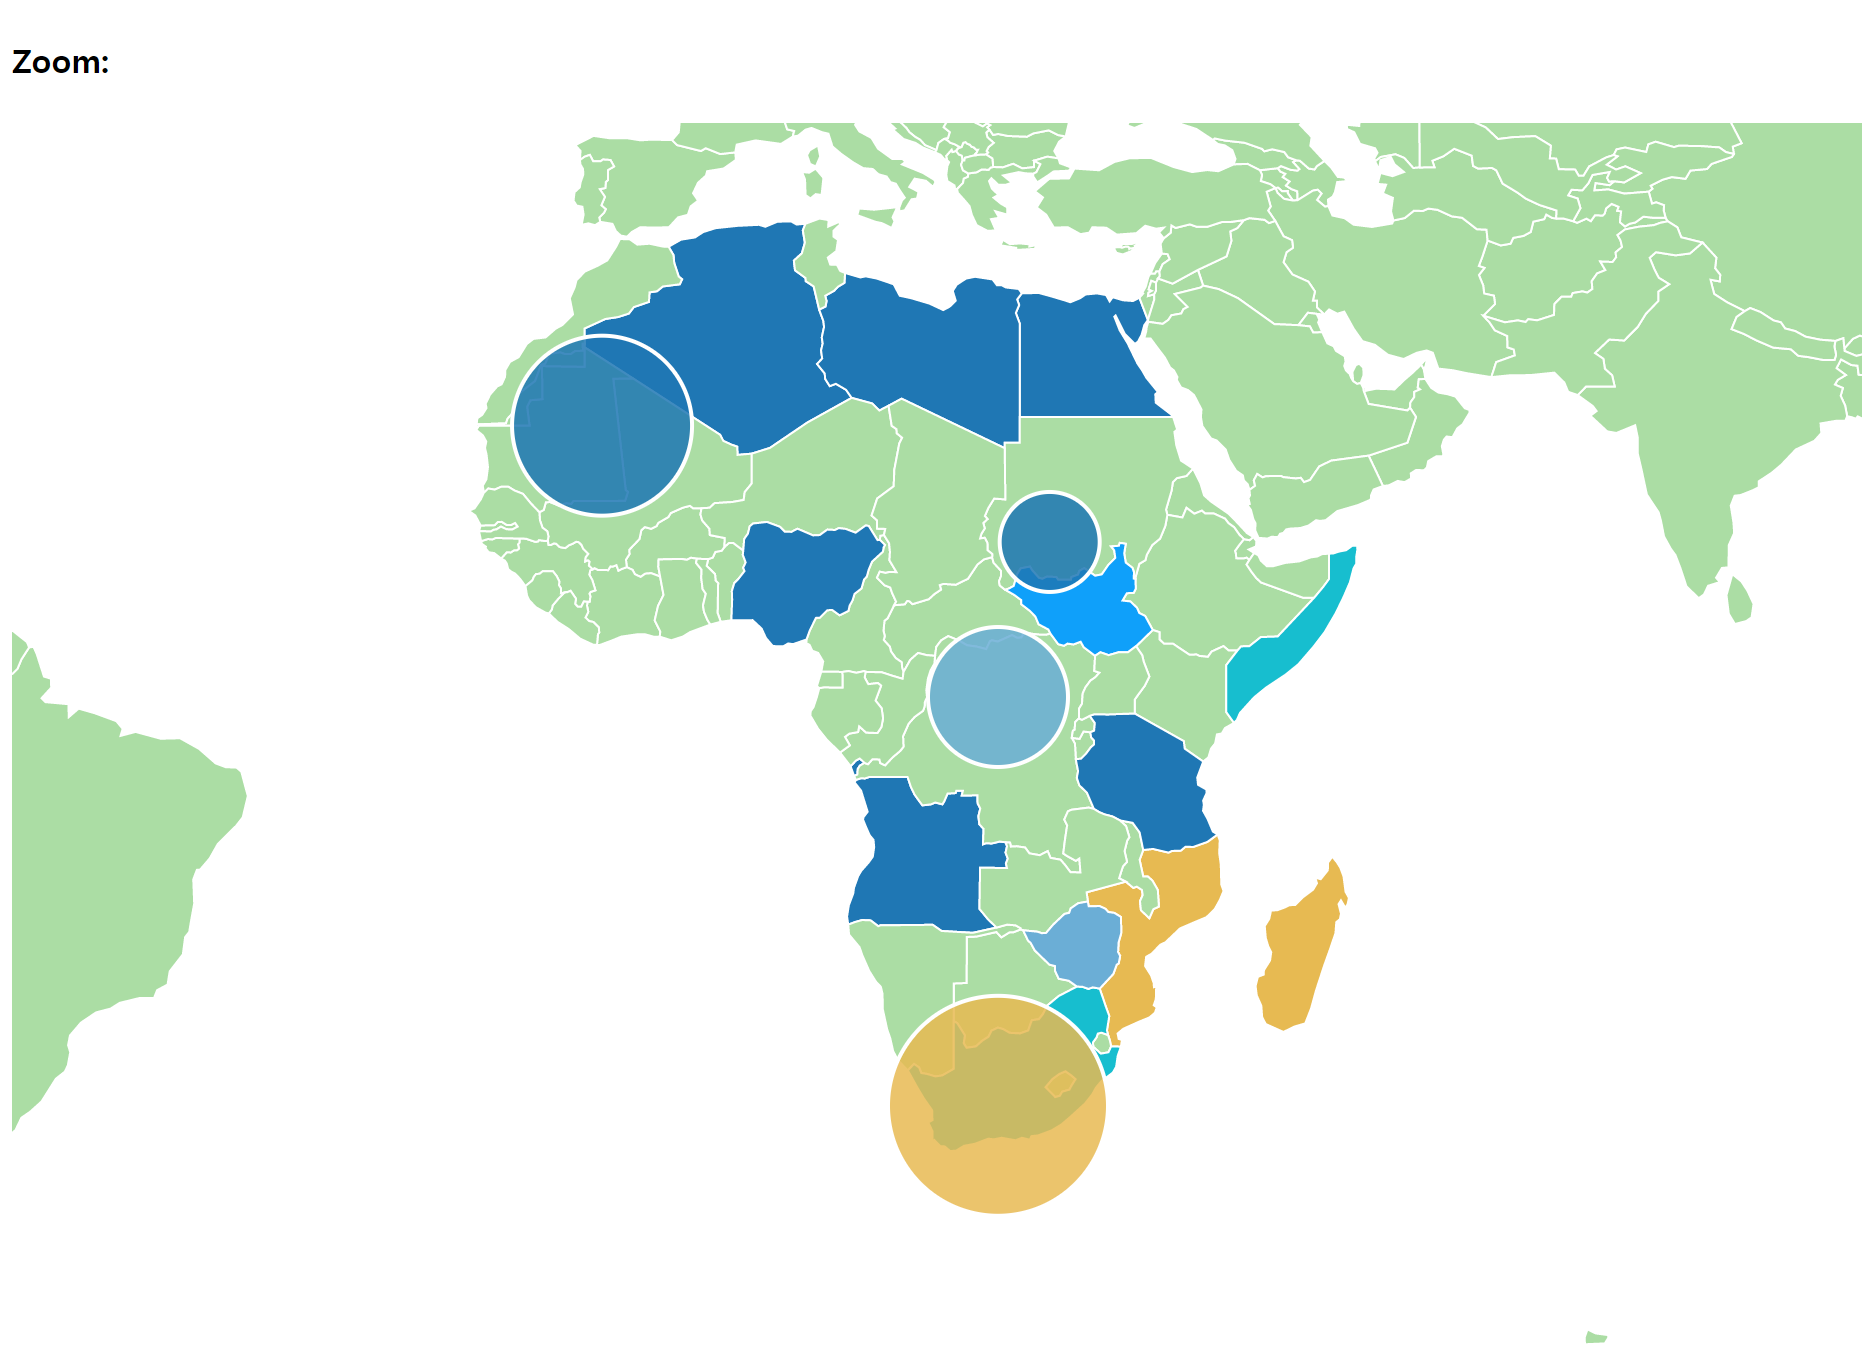
<h4>Zoom:</h4>
<vue-datamaps
:scope="scope"
:data="data"
:fills="fills"
:bubblesConfig="bubblesConfig"
bubbles
@custom:popup-bubble="popupTemplate"
:setProjection="setProjection('zoom')"
>
<div slot="hoverBubbleInfo" class="hoverinfo" style="text-align:center;">
{{ popupData.name }}
</div>
</vue-datamaps>
</div>
</template>
<script>
import { VueDatamaps } from 'vue-datamaps'
import * as d3 from 'd3v4'
export default {
components: {
VueDatamaps
},
data () {
return {
scope: 'world',
fills: {
defaultFill: '#ABDDA4',
gt50: d3.schemeCategory20[Math.floor(Math.random() * 20)],
eq50: d3.schemeCategory20b[Math.floor(Math.random() * 20)],
lt25: d3.schemeCategory20c[Math.floor(Math.random() * 20)],
gt75: d3.schemeCategory20[Math.floor(Math.random() * 20)],
lt50: d3.schemeCategory10[Math.floor(Math.random() * 10)],
eq0: d3.schemeCategory10[Math.floor(Math.random() * 1)],
pink: '#0fa0fa',
gt500: d3.schemeCategory10[Math.floor(Math.random() * 1)]
},
data: {
'ZAF': { fillKey: 'gt50' },
'ZWE': { fillKey: 'lt25' },
'NGA': { fillKey: 'lt50' },
'MOZ': { fillKey: 'eq50' },
'MDG': { fillKey: 'eq50' },
'EGY': { fillKey: 'gt75' },
'TZA': { fillKey: 'gt75' },
'LBY': { fillKey: 'eq0' },
'DZA': { fillKey: 'gt500' },
'SSD': { fillKey: 'pink' },
'SOM': { fillKey: 'gt50' },
'GIB': { fillKey: 'eq50' },
'AGO': { fillKey: 'lt50' }
},
bubblesConfig: {
popupOnHover: true,
popupTemplate: true,
data: [
{ name: 'Bubble 1', latitude: 21.32, longitude: -7.32, radius: 45, fillKey: 'gt500' },
{ name: 'Bubble 2', latitude: 12.32, longitude: 27.32, radius: 25, fillKey: 'eq0' },
{ name: 'Bubble 3', latitude: 0.32, longitude: 23.32, radius: 35, fillKey: 'lt25' },
{ name: 'Bubble 4', latitude: -31.32, longitude: 23.32, radius: 55, fillKey: 'eq50' }
]
},
popupData: {
name: ''
}
}
},
methods: {
popupTemplate ({ datum }) {
this.popupData.name = `Bubble for ${datum.name}`
},
setProjection (type) {
const createProjection = {
korea: function (d3, element) {
const projection = d3.geoMercator().center([0, 0])
.rotate([-128, -36])
.scale(element.offsetWidth * 6)
.translate([element.offsetWidth / 2, element.offsetHeight / 2])
const path = d3.geoPath().projection(projection)
return { projection, path }
},
zoom: function (d3, element) {
var projection = d3.geoEquirectangular()
.center([23, -3])
.rotate([4.4, 0])
.scale(element.offsetHeight * 0.6)
.translate([element.offsetWidth / 2, element.offsetHeight / 2])
var path = d3.geoPath()
.projection(projection)
return { path: path, projection: projection }
}
}
return createProjection[type]
}
}
}
</script>
<style>
</style>
<template>
<div>
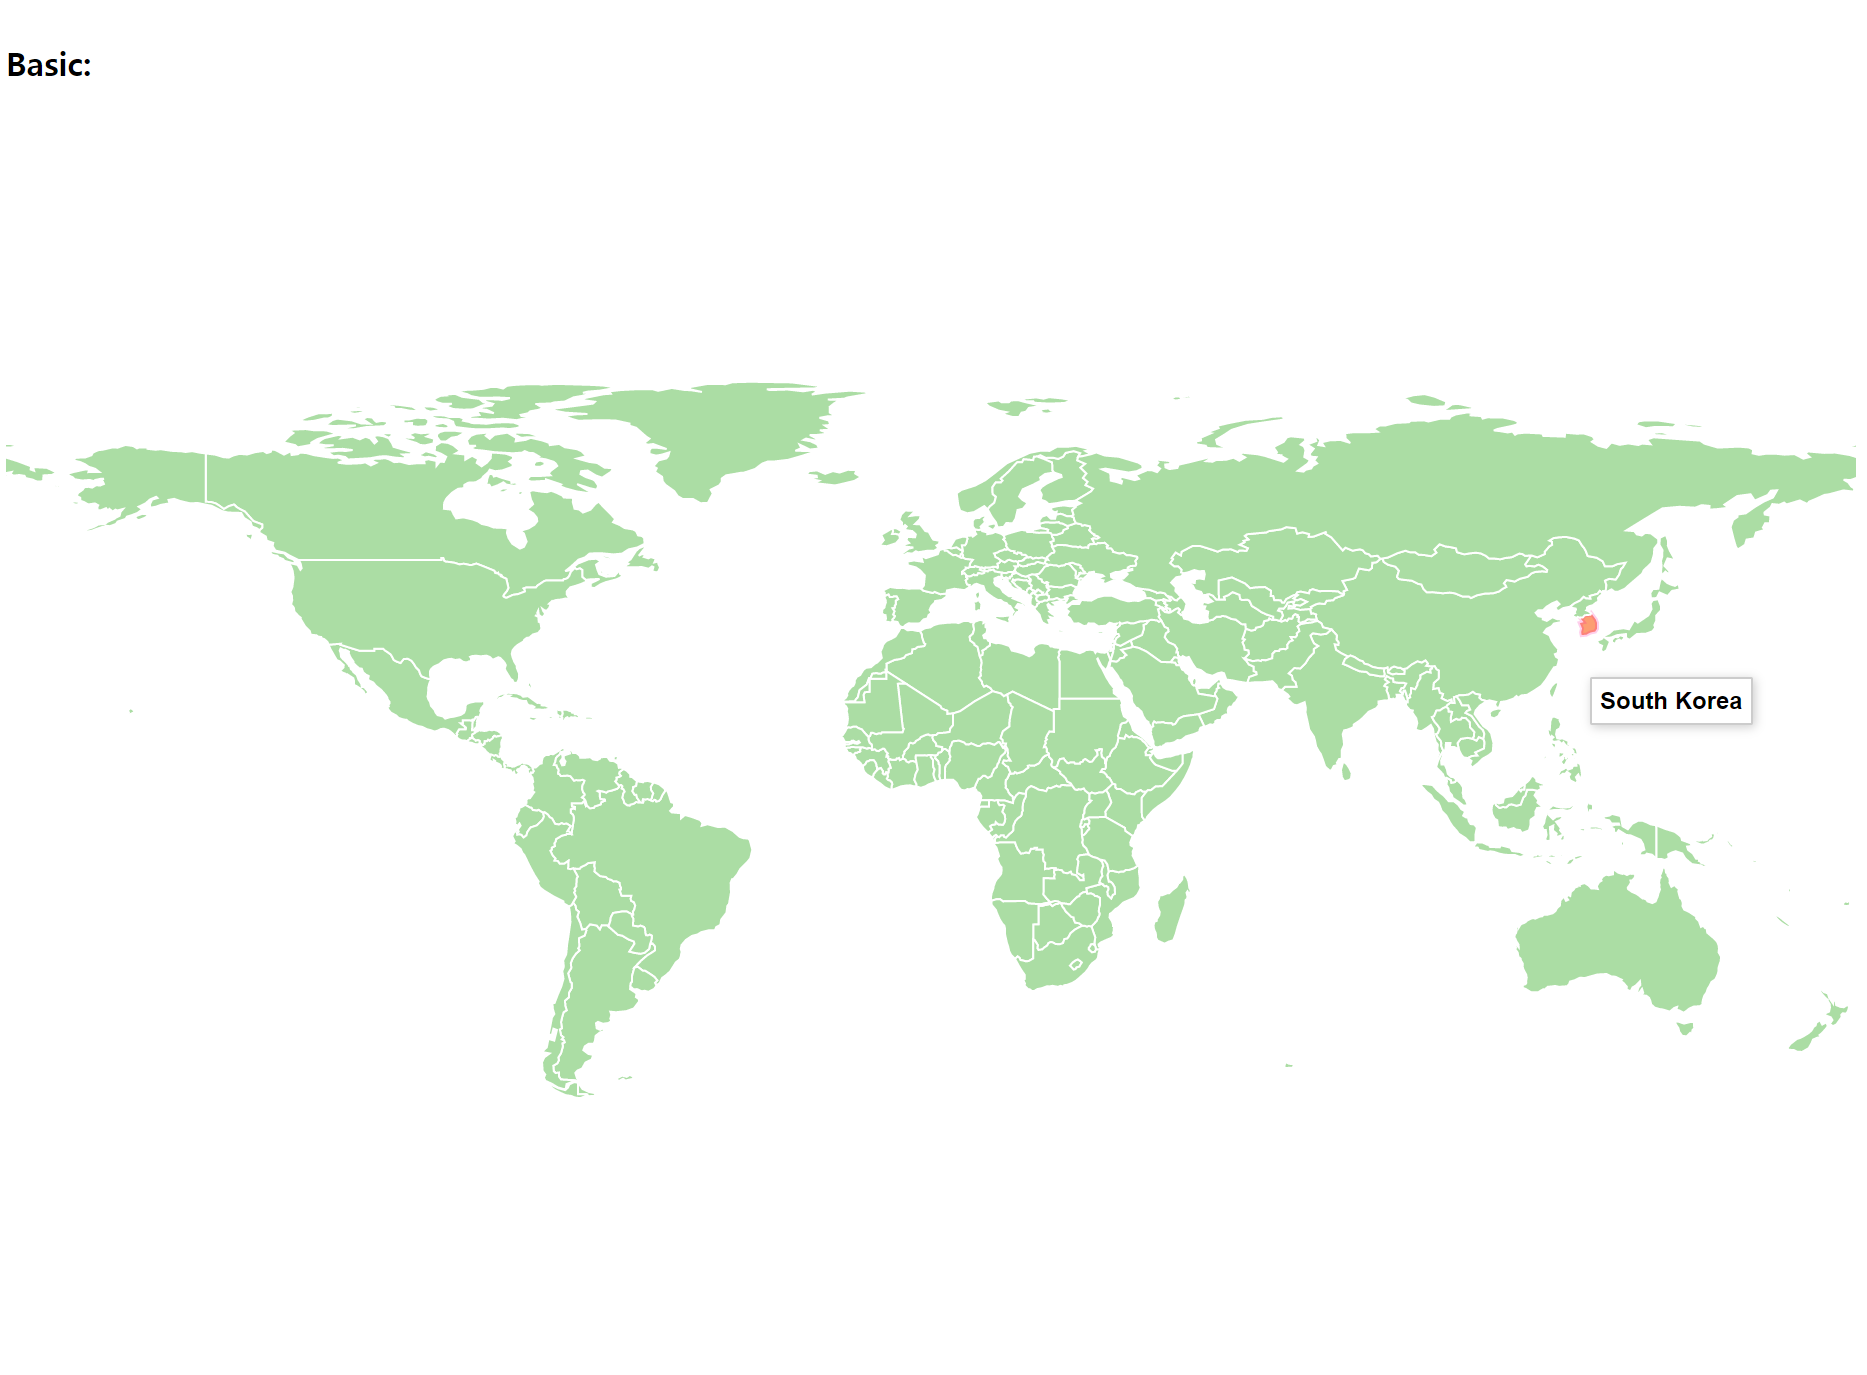
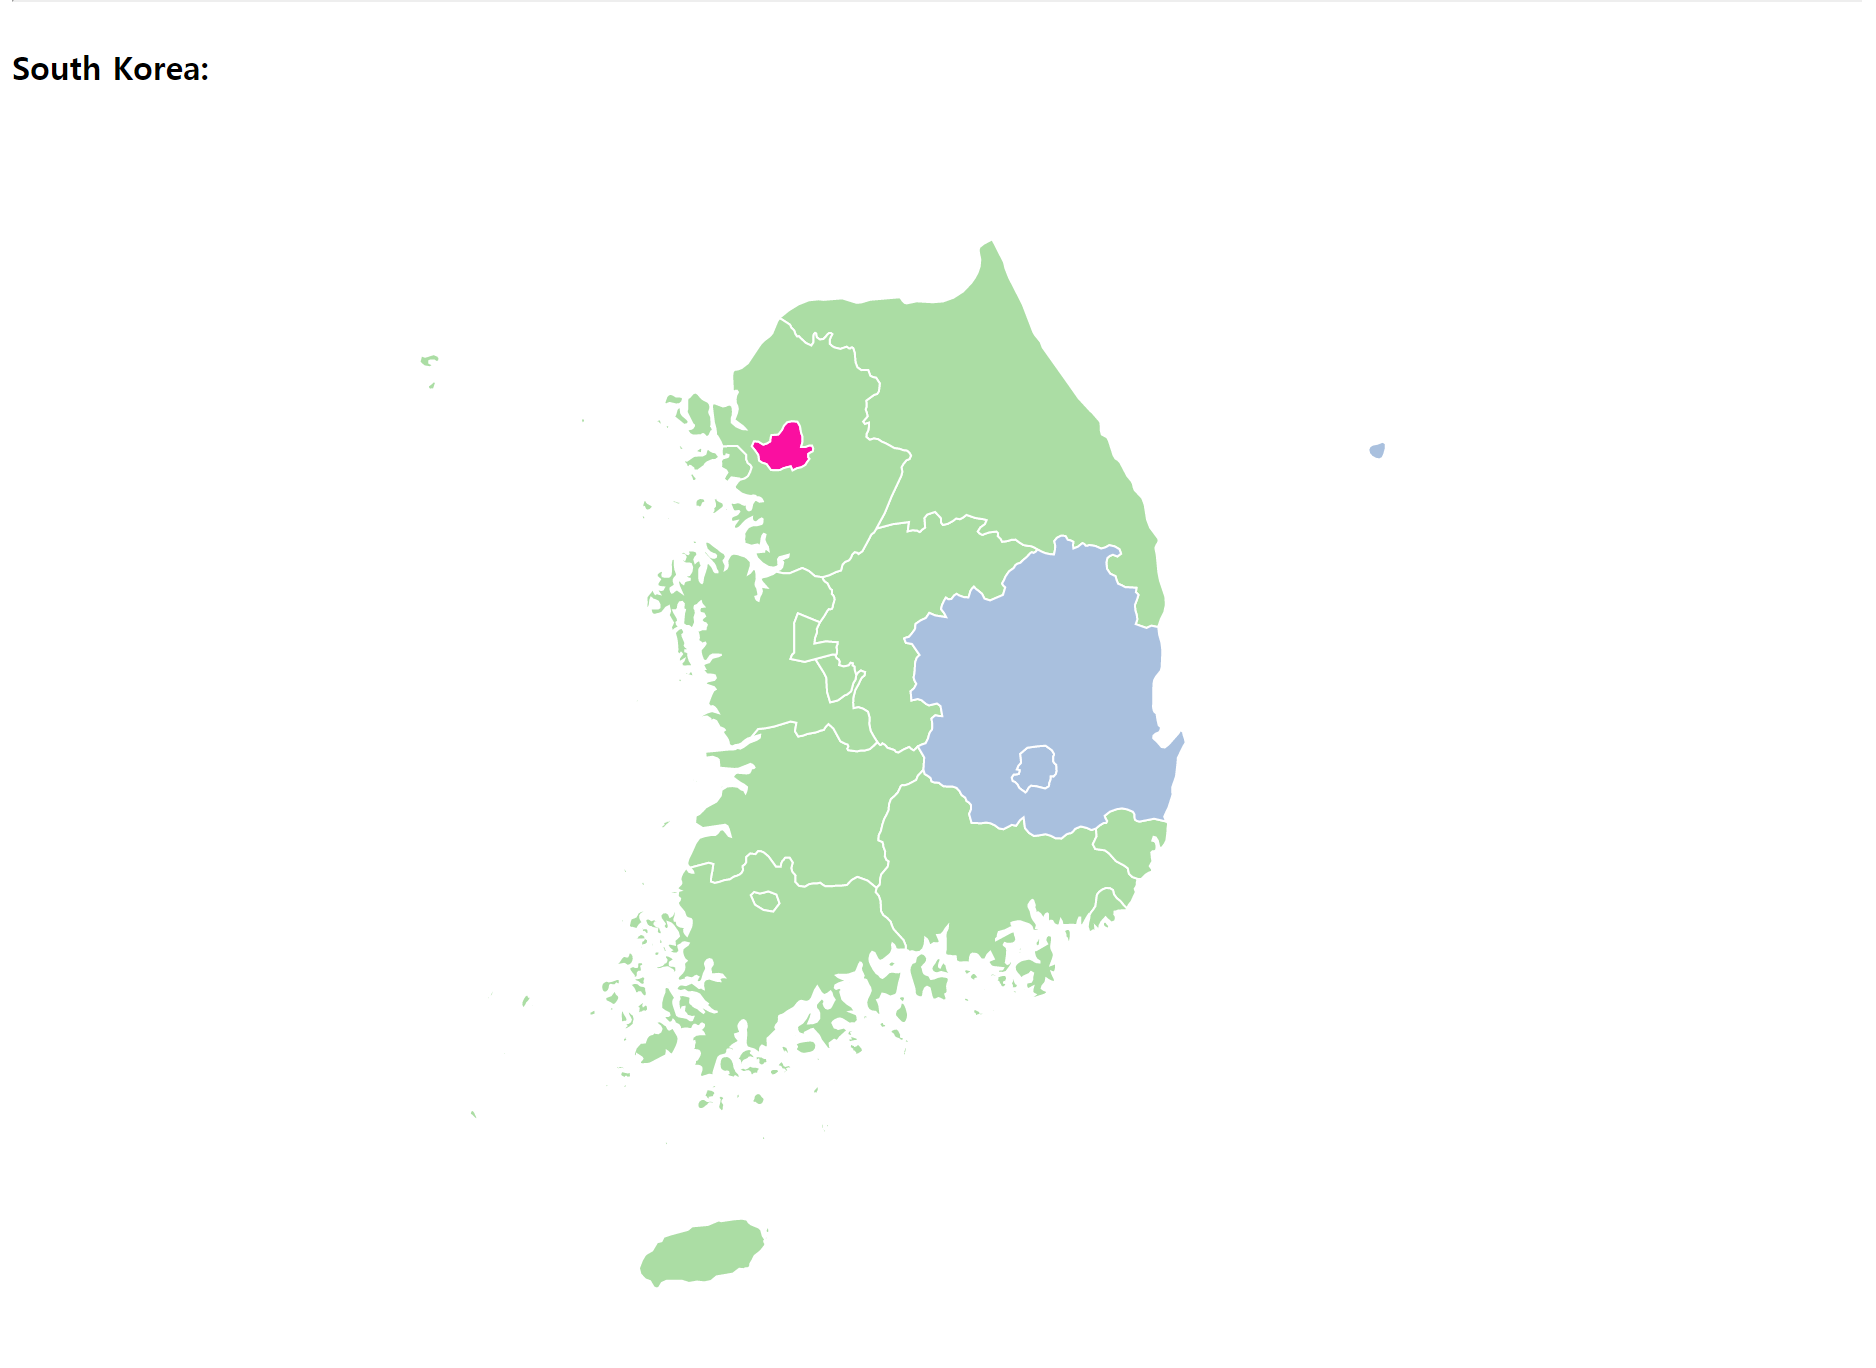
<h4>South Korea:</h4>
<vue-datamaps
:scope="scope"
:setProjection="setProjection('korea')"
:fills="fills"
:data="data"
/>
</div>
</template>
<script>
import { VueDatamaps } from 'vue-datamaps'
export default {
components: {
VueDatamaps
},
data () {
return {
scope: 'kor',
fills: {
color1: '#fa0fa0',
color2: '#A9C0DE'
},
data: {
'KR.SO': {
fillKey: 'color1'
},
'KR.TG': {
fillKey: 'color2'
}
}
}
},
methods: {
setProjection (type) {
const createProjection = {
korea: function (d3, element) {
const projection = d3.geoMercator().center([0, 0])
.rotate([-128, -36])
.scale(element.offsetWidth * 6)
.translate([element.offsetWidth / 2, element.offsetHeight / 2])
const path = d3.geoPath().projection(projection)
return { projection, path }
},
zoom: function (d3, element) {
var projection = d3.geoEquirectangular()
.center([23, -3])
.rotate([4.4, 0])
.scale(element.offsetHeight * 0.6)
.translate([element.offsetWidth / 2, element.offsetHeight / 2])
var path = d3.geoPath()
.projection(projection)
return { path: path, projection: projection }
}
}
return createProjection[type]
}
}
}
</script>
<style>
</style>
<template>
<div>
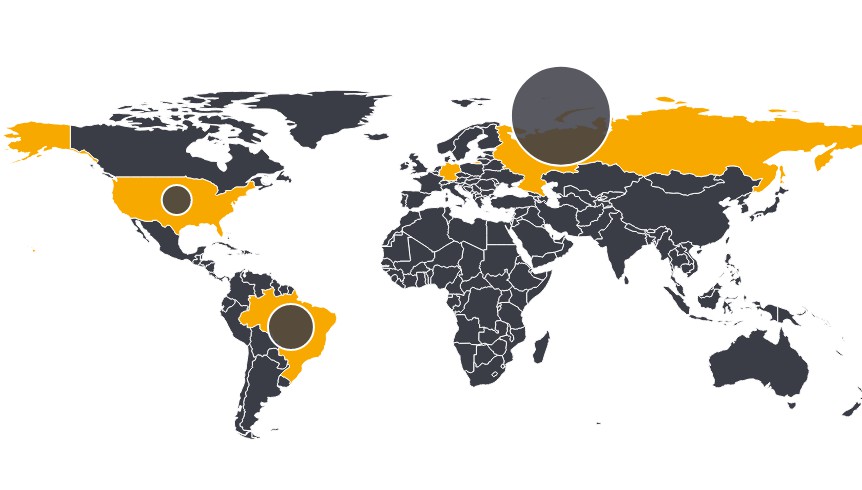
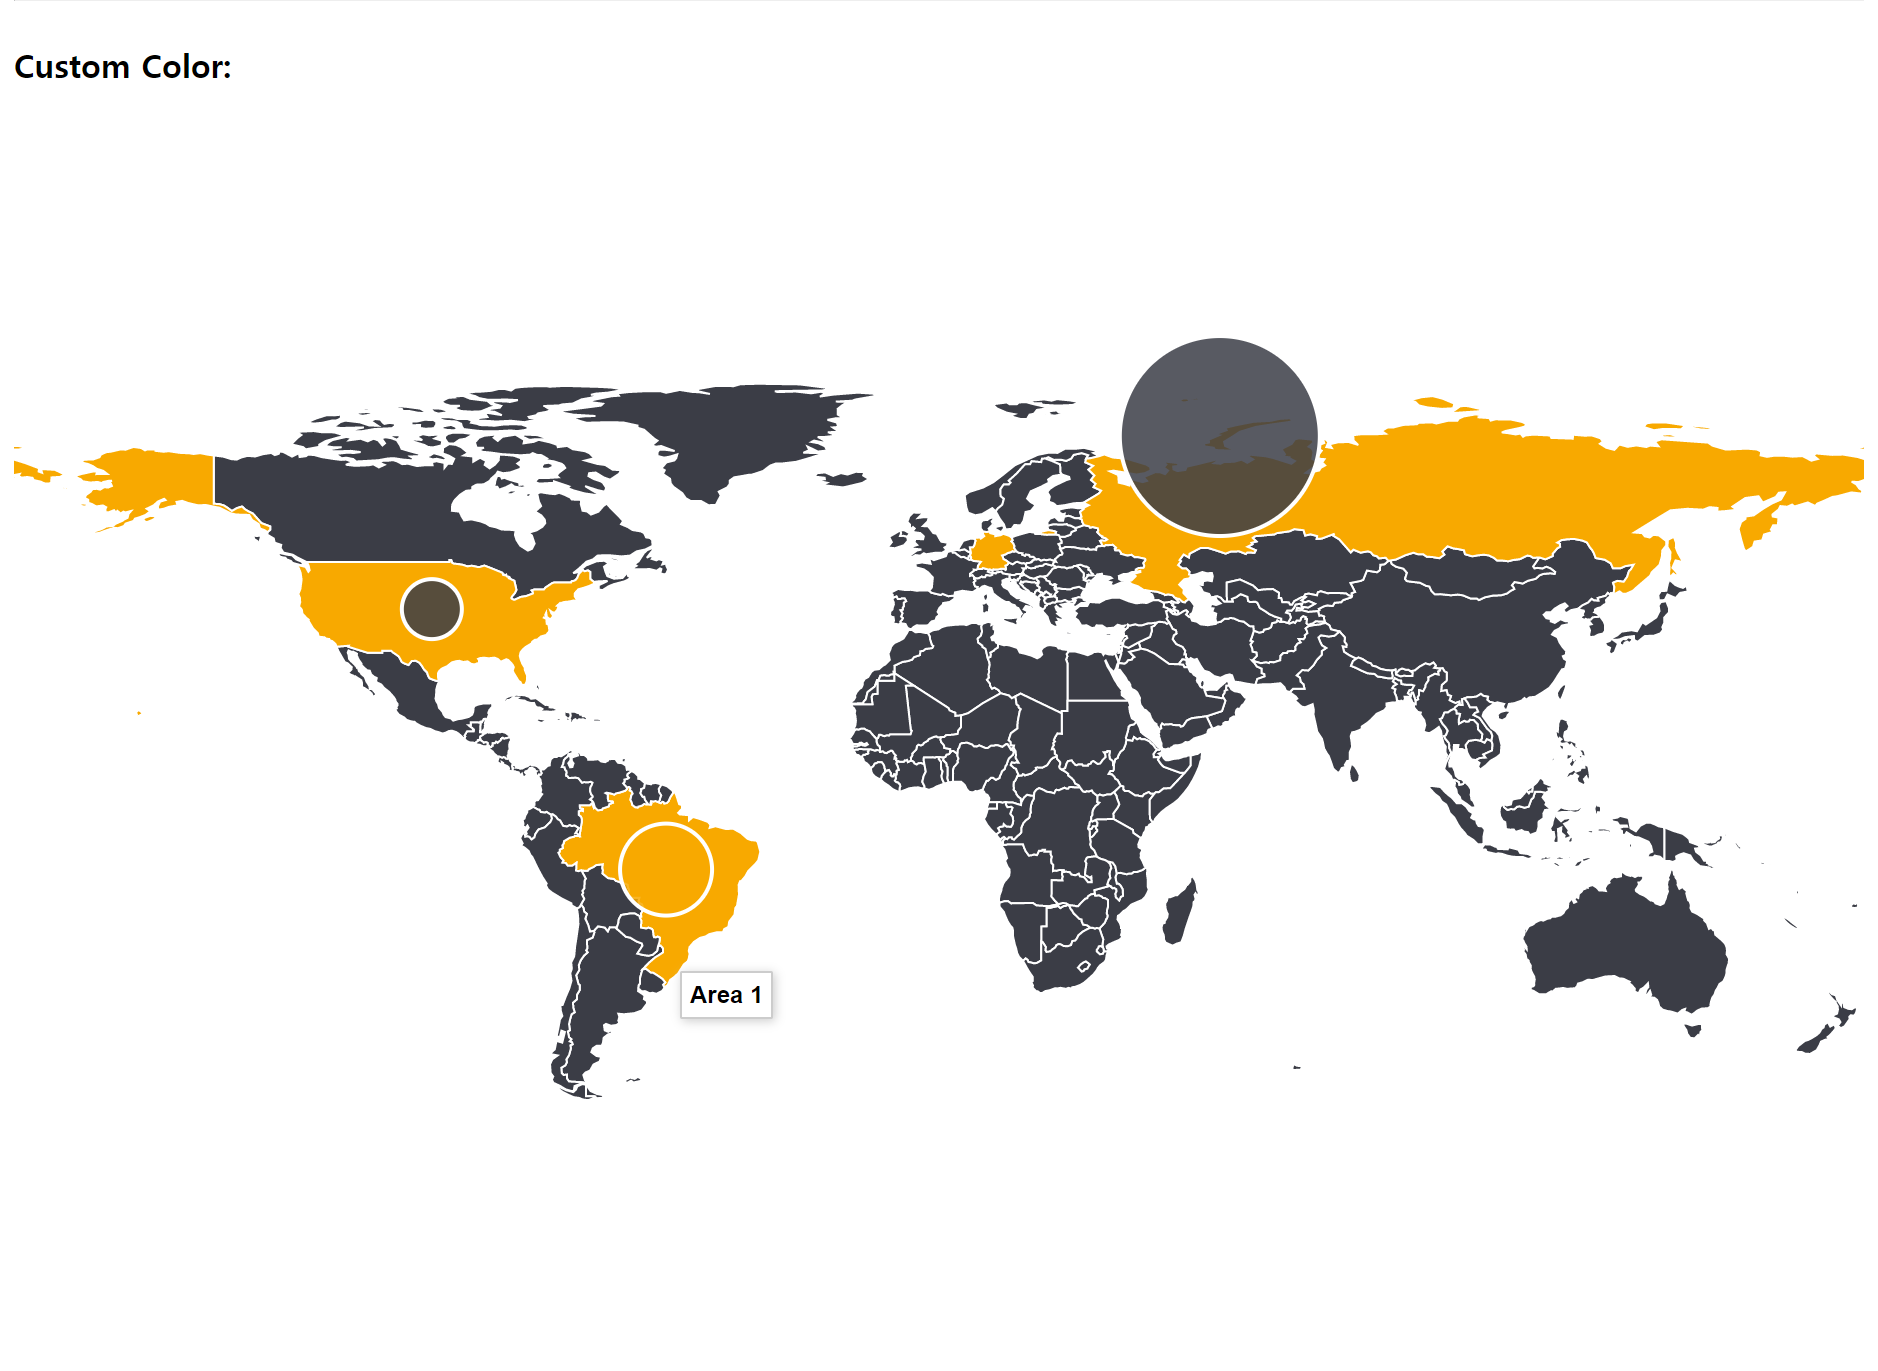
<h4>Custom Color:</h4>
<vue-datamaps
:fills="fills"
:data="data"
:geographyConfig="geographyConfig"
bubbles
:bubblesConfig="bubblesConfig"
/>
</div>
</template>
<script>
import { VueDatamaps } from 'vue-datamaps'
export default {
components: {
VueDatamaps
},
data () {
return {
bubblesConfig: {
data: [
{
name: 'Area 1',
radius: 23,
centered: 'BRA'
},
{
name: 'Area 2',
radius: 15,
centered: 'USA'
},
{
name: 'Area 3',
radius: 50,
latitude: 73.482,
longitude: 54.5854
}
],
highlightBorderColor: '#FFFFFF',
highlightFillColor: '#F8A900'
},
geographyConfig: {
popupOnHover: false,
highlightOnHover: false,
borderWidth: 0
},
data: {
USA: { fillKey: 'active' },
RUS: { fillKey: 'active' },
DEU: { fillKey: 'active' },
BRA: { fillKey: 'active' }
},
fills: {
defaultFill: '#3B3D46',
active: '#F8A900'
}
}
}
}
</script>
<style>
</style>
<template>
<div>
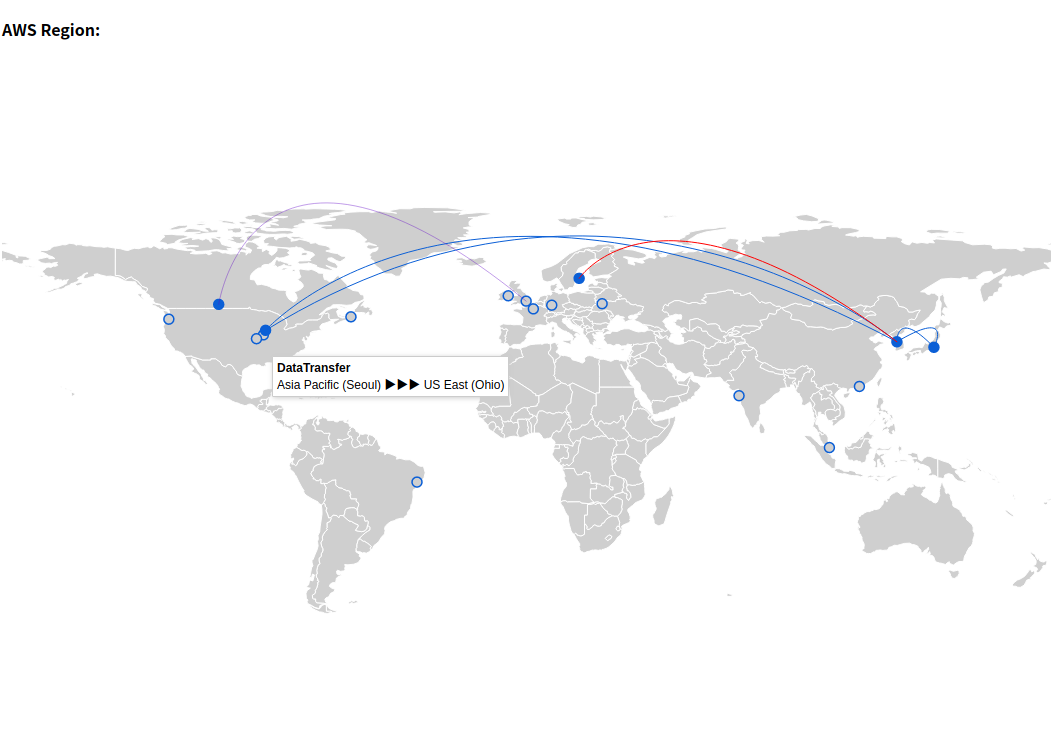
<h4>AWS Region:</h4>
<vue-datamaps
:geographyConfig="geographyConfig"
:fills="fills"
:arcConfig="arcConfig"
arc
aws-regions
:awsRegionsConfig="awsRegionsConfig"
@custom:popup-arc="popupTemplate"
>
<div slot="hoverArcInfo" class="hoverinfo">
<strong>{{ popupData.title }}</strong><br>
{{ popupData.origin }} ▶▶▶ {{ popupData.destination }}
</div>
</vue-datamaps>
</div>
</template>
<script>
import { VueDatamaps } from 'vue-datamaps'
export default {
components: {
VueDatamaps
},
data () {
return {
geographyConfig: {
dataUrl: '',
popupOnHover: false,
highlightOnHover: false
},
fills: {
defaultFill: '#cfcfcf',
active: '#0b5fd6'
},
awsRegionsConfig: {
popupOnHover: true,
data: [
{
code: 'ap-northeast-2',
fillKey: 'active'
},
{ code: 'ap-northeast-1',
fillKey: 'active'
},
{ code: 'us-east-2',
fillKey: 'active'
},
{ code: 'eu-north-1',
fillKey: 'active'
},
{ code: 'ca-central-1',
fillKey: 'active'
}
]
},
arcConfig: {
popupOnHover: true,
popupTemplate: true,
data: [
{
origin: 'ap-northeast-2',
destination: 'ap-northeast-1',
options: {
arcSharpness: 0.5
}
},
{
origin: 'ap-northeast-1',
destination: 'ap-northeast-2',
options: {
arcSharpness: 0.5
}
},
{
origin: 'us-east-2',
destination: 'ap-northeast-2',
options: {
arcSharpness: 3
}
},
{
origin: 'ap-northeast-2',
destination: 'us-east-2',
options: {
arcSharpness: 3
}
},
{
origin: 'eu-north-1',
destination: 'ap-northeast-2',
options: {
strokeColor: 'red',
arcSharpness: 2
}
},
{
origin: 'ca-central-1',
destination: 'eu-west-2',
options: {
strokeColor: 'rgba(100, 10, 200, 0.4)',
arcSharpness: 3
}
}
],
strokeColor: '#0b5fd6',
greatArc: true,
animationSpeed: 2000
},
popupData: {
title: 'DataTransfer',
origin: '',
destination: ''
}
}
},
methods: {
popupTemplate (datum) {
this.popupData.origin = datum.origin.full_name
this.popupData.destination = datum.destination.full_name
}
}
}
</script>
<style>
</style>
Available Props Option
scope
- type: String
- value: world, usa, custom_map
Same as the original.
setProjection
- type: Function
- value: See sample code.
Same as original but d3 version different.
projection
- type: String
- value: Equirectangular, Orthographic, Mercator
Same as original but PascalCase.
dataType
- type: String
- value json, csv
Same as original.
data
- type: Object
- value: See sample code.
Same as original.
done
- type: Function
Not implemented.
fills
- type: Object
- value: The keys in this object map to the "fillKey" of [data] or [data of bubbles]
Same as original.
geographyConfig
- type: Object
- value: See sample code.
Same as original but not include popupTemplate.
bubblesConfig
- type: Object
- value: See sample code.
Same as original but not include popupTemplate.
bubbles
- type: Boolean
- value: true, false
IfbubblesConfigrequired.
arcConfig
- type: Object
- value: See sample code.
Same as original but not include popupTemplate.
arc
- type: Boolean
- value: true, false
If arcConfig required.
disableDefaultStyles
- type: Boolean
- value: true, false
Not implemented.
labelsConfig
- type: Object
- value: See sample code.
Same as original.
labels
- type: Boolean
- value: true, false
If labelsConfig required.
popupTemplate
- type: Boolean
- value: true, false
If slot hoverinfo and event custom:popup||custom:popup-bubble||custom:popup-arc||custom:popup-region|| required.
Default Props Option
{
  scope: 'world',
  setProjection: (d3, element) => {
    let projection = null
    let path = null
    if (this.scope === 'usa') {
        projection = d3.geoAlbersUsa()
            .scale(this.svgWidth)
            .translate([this.svgWidth / 2, this.svgHeight / 2])
    } else if (this.scope === 'world') {
        projection = d3[`geo${this.projection}`]()
            .scale((this.svgWidth + 1) / 2 / Math.PI)
            .translate([this.svgWidth / 2, this.svgHeight / (this.projection === 'Mercator' ? 1.45 : 1.8)])
    }
    if (this.projection === 'Orthographic') {
        this.svg.append('defs').append('path')
            .datum({ type: 'Sphere' })
            .attr('id', 'sphere')
            .attr('d', path)

        this.svg.append('use')
            .attr('class', 'stroke')
            .attr('xlink:href', '#sphere')

        this.svg.append('use')
            .attr('class', 'fill')
            .attr('xlink:href', '#sphere')
        projection.scale(this.svgWidth / Math.PI * 0.9).clipAngle(90).rotate(this.projectionConfigOptions.rotation)
    }

    path = d3.geoPath()
        .projection(projection)
    return { projection, path }
  },
  projection: 'Equirectangular',
  dataType: 'json',
  data: {},
  done: function () {
    return {}
  },
  fills: {
    authorHasTraveledTo: '#fa0fa0',
    defaultFill: '#ABDDA4'
  },
  geographyConfig: {
    dataUrl: null,
    hideAntarctica: true,
    hideHawaiiAndAlaska: false,
    borderWidth: 1,
    borderOpacity: 1,
    borderColor: '#FDFDFD',
    popupOnHover: true,
    highlightOnHover: true,
    highlightFillColor: '#FC8D59',
    highlightBorderColor: 'rgba(250, 15, 160, 0.2)',
    highlightBorderWidth: 2,
    highlightBorderOpacity: 1,
    highlightFillOpacity: 0.85
  },
  projectionConfig: {
    rotation: [97, 0]
  },
  bubblesConfig: {
    borderWidth: 2,
    borderOpacity: 1,
    borderColor: '#FFFFFF',
    popupOnHover: true,
    radius: null,
    fillOpacity: 0.75,
    animate: true,
    highlightOnHover: true,
    highlightFillColor: '#FC8D59',
    highlightBorderColor: 'rgba(250, 15, 160, 0.2)',
    highlightBorderWidth: 2,
    highlightBorderOpacity: 1,
    highlightFillOpacity: 0.85,
    exitDelay: 100,
    key: JSON.stringify,
    data: []
  },
  bubbles: false,
  arcConfig: {
    strokeColor: '#DD1C77',
    strokeWidth: 1,
    arcSharpness: 1,
    animationSpeed: 600,
    popupOnHover: false,
    data: []
  },
  arc: false,
  disableDefaultStyles: false,
  labelsConfig: {
    fontSize: 10,
    fontFamily: 'Verdana',
    labelColor: '#000',
    lineWidth: 1
  },
  labels: false,
  popupTemplate: false,
  awsRegions: false,
  awsRegionsConfig: {
    strokeColor: '#0b5fd6',
    strokeWidth: 1.5,
    defaultFill: 'transparent',
    highlightFillOpacity: 1,
    showPrivateRegions: false,
    popupOnHover: false,
    data: []
  }
}
Slot & Event for @mouseover
- when geography mouse hover:
- slot:
hoverinfo - event:
custom:popup
- slot:
  <div slot="hoverinfo" class="hoverinfo" style="text-align:center;">
    <!-- ... -->
  </div>
- when bubbles mouse hover:
- slot:
hoverBubbleInfo - event:
custom:popup-bubble
- slot:
  <div slot="hoverBubbleInfo" class="hoverinfo" style="text-align:center;">
    <!-- ... -->
  </div>
- when arc mouse hover:
- slot:
hoverArcInfo - event:
custom:popup-arc
- slot:
  <div slot="hoverArcInfo" class="hoverinfo" style="text-align:center;">
    <!-- ... -->
  </div>
- when aws-region mouse hover
- slot:
hoverRegionInfo - event:
custom:popup-region
- slot:
  <div slot="hoverRegionInfo" class="hoverinfo" style="text-align:center;">
    <!-- ... -->
  </div>
Inspired
- markmarkoh/datamaps - original
- btmills/react-datamaps - React-based datamaps library
- jsonmaur/aws-regions - AWS Regions and Availability Zones
License
MIT