Stock Chart
Simple stock chart visualizer made in Vue.js: https://vuejs.org/ using API data from https://financialmodelingprep.com. Charts are generated with the Charts.js library: https://www.chartjs.org/.

What can i do?
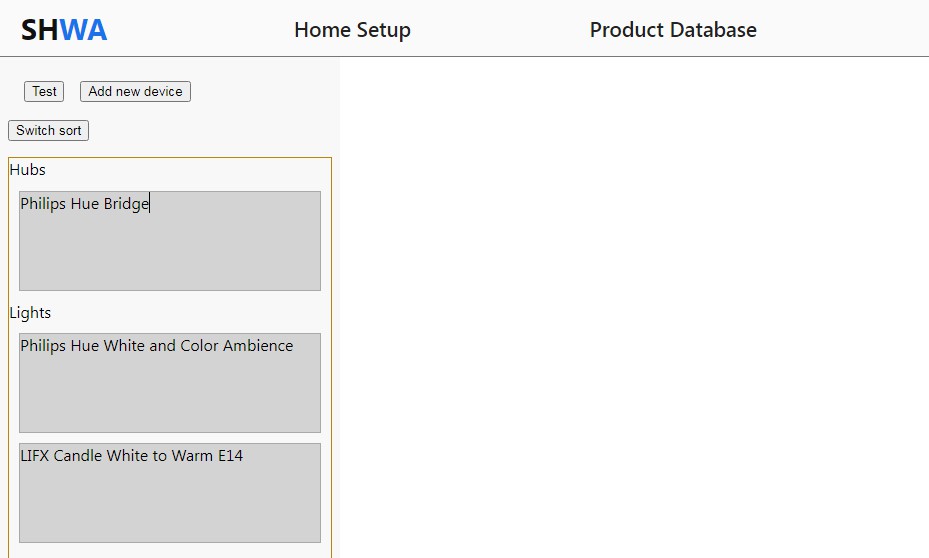
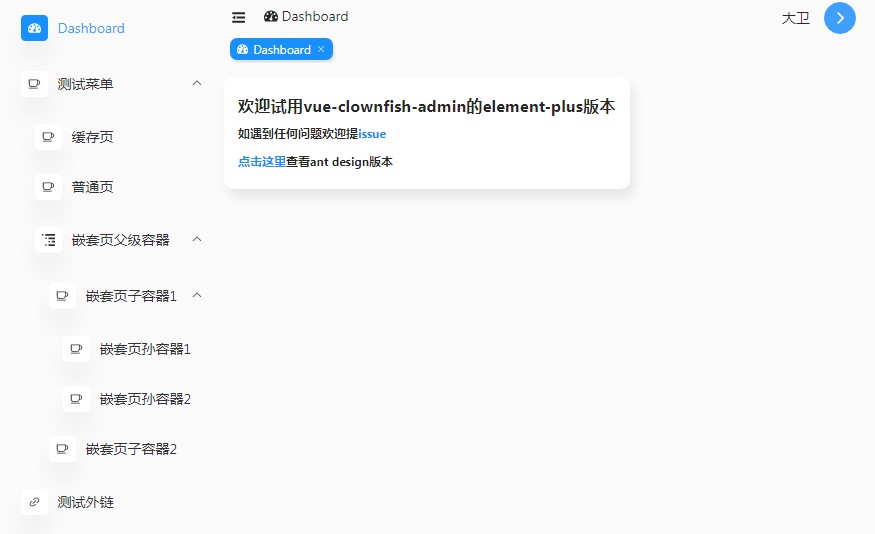
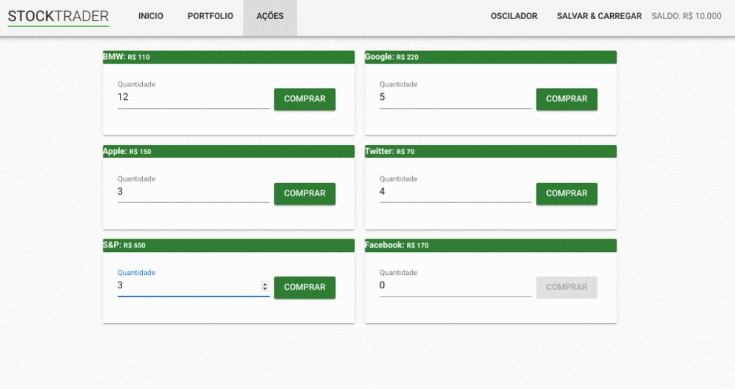
This webapp visualizes stock data as well as the securities most common indicators, it gives you the option to change variables, such as: Different indicators, indicator periods and stock timelines. I have added a navbar to the right of the page, that i haven’t configured. But thats up for the imagination.
disclaimer
This webapp is fully made with Vue.js as a fun project, you can use any component or section of code as you’d like.