Vue Chartkick
Create beautiful JavaScript charts with one line of Vue.
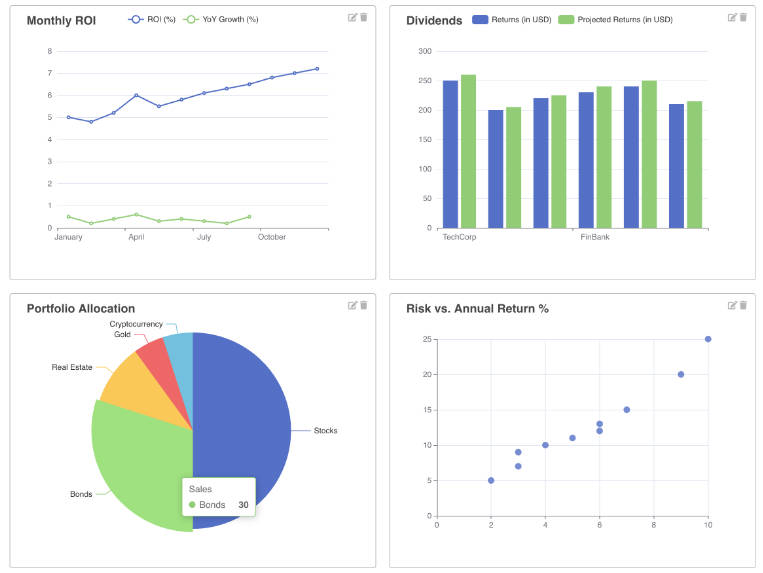
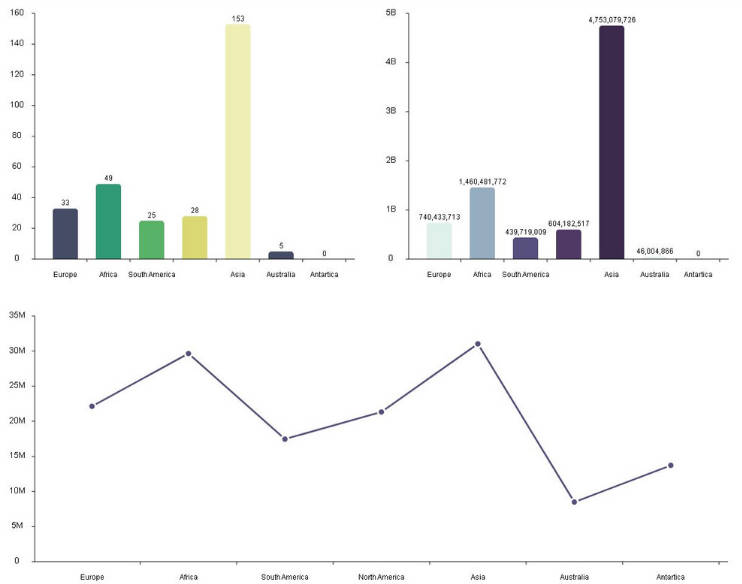
Charts
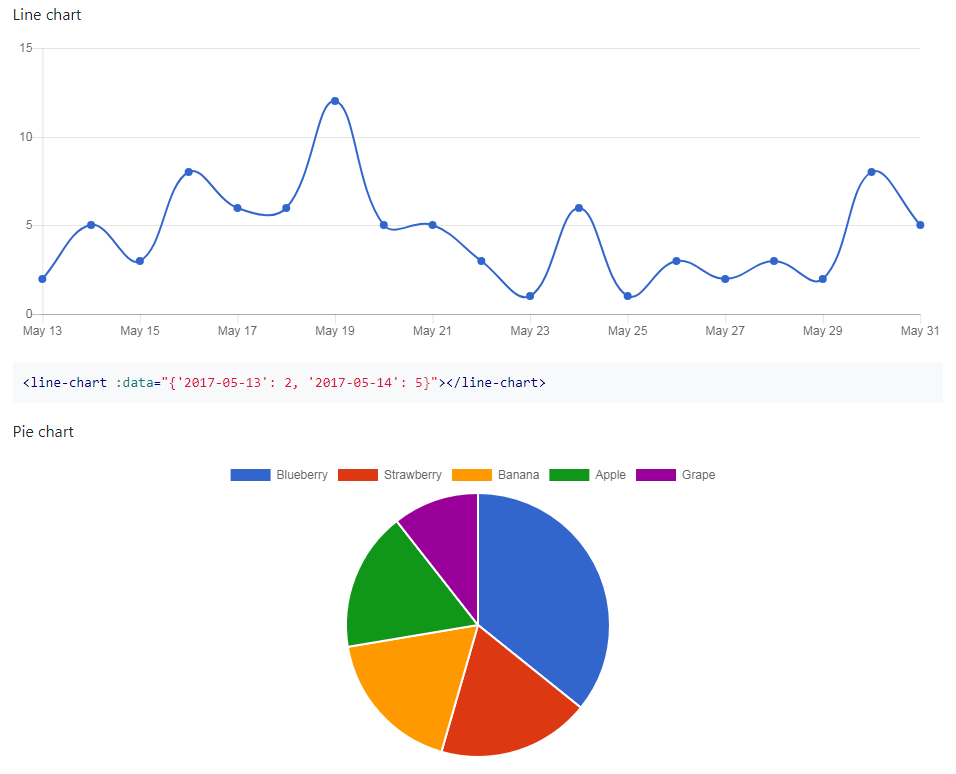
Line chart
<line-chart :data="{'2017-01-01': 11, '2017-01-02': 6}"></line-chart>
Pie chart
<pie-chart :data="[['Blueberry', 44], ['Strawberry', 23]]"></pie-chart>
Column chart
<column-chart :data="[['Sun', 32], ['Mon', 46], ['Tue', 28]]"></column-chart>
Bar chart
<bar-chart :data="[['Work', 32], ['Play', 1492]]"></bar-chart>
Area chart
<area-chart :data="{'2017-01-01': 11, '2017-01-02': 6}"></area-chart>
Scatter chart
<scatter-chart :data="[[174.0, 80.0], [176.5, 82.3]]" xtitle="Size" ytitle="Population"></scatter-chart>
Geo chart - Google Charts
<geo-chart :data="[['United States', 44], ['Germany', 23], ['Brazil', 22]]"></geo-chart>
Timeline - Google Charts
<timeline :data="[['Washington', '1789-04-29', '1797-03-03'], ['Adams', '1797-03-03', '1801-03-03']]"></timeline>
Multiple series
data = [
  {name: 'Workout', data: {'2017-01-01': 3, '2017-01-02': 4}},
  {name: 'Call parents', data: {'2017-01-01': 5, '2017-01-02': 3}}
];

// and
<line-chart :data="data" />
Say Goodbye To Timeouts
Make your pages load super fast and stop worrying about timeouts. Give each chart its own endpoint.
<line-chart data="/stocks"></line-chart>
Options
Id, width, and height
<line-chart id="users-chart" width="800px" height="500px"></line-chart>
Min and max values
<line-chart :min="1000" :max="5000"></line-chart>
min defaults to 0 for charts with non-negative values. Use null to let the charting library decide.
Colors
<line-chart :colors="['#b00', '#666']"></line-chart>
Stacked columns or bars
<column-chart :stacked="true"></column-chart>
Discrete axis
<line-chart :discrete="true"></line-chart>
Label (for single series)
<line-chart label="Value"></line-chart>
Axis titles
<line-chart xtitle="Time" ytitle="Population"></line-chart>
Straight lines between points instead of a curve
<line-chart :curve="false"></line-chart>
Show or hide legend
<line-chart :legend="true"></line-chart>
Specify legend position
<line-chart legend="bottom"></line-chart>
Donut chart
<pie-chart :donut="true"></pie-chart>
Prefix, useful for currency - Chart.js, Highcharts
<line-chart prefix="$"></line-chart>
Suffix, useful for percentages - Chart.js, Highcharts
<line-chart suffix="%"></line-chart>
Set a thousands separator - Chart.js, Highcharts
<line-chart thousands=","></line-chart>
Set a decimal separator - Chart.js, Highcharts
<line-chart decimal=","></line-chart>
Show a message when data is empty
<line-chart :messages="{empty: 'No data'}"></line-chart>
Refresh data from a remote source every n seconds
<line-chart :refresh="60"></line-chart>
You can pass options directly to the charting library with:
<line-chart :library="{backgroundColor: '#eee'}"></line-chart>
See the documentation for Google Charts, Highcharts, and Chart.js for more info.
Data
Pass data as an array or object
<pie-chart :data="{'Blueberry': 44, 'Strawberry': 23}"></pie-chart>
<pie-chart :data="[['Blueberry', 44], ['Strawberry', 23]]"></pie-chart>
Times can be a Date, a timestamp, or a string (strings are parsed)
<line-chart :data="[[new Date(), 5], [1368174456, 4], ['2017-01-01 00:00:00 UTC', 7]]"></line-chart>
Download Charts
Chart.js only
Give users the ability to download charts. It all happens in the browser - no server-side code needed.
<line-chart :download="true"></line-chart>
Set the filename
<line-chart download="boom"></line-chart>
Note: Safari will open the image in a new window instead of downloading.
Installation
Run
yarn add chartkick vue-chartkick
Chart.js
Run
yarn add chart.js
And add
import Chartkick from 'chartkick'
import VueChartkick from 'vue-chartkick'
import Chart from 'chart.js'

Vue.use(VueChartkick, { Chartkick })
Google Charts
Add
import Chartkick from 'chartkick'
import VueChartkick from 'vue-chartkick'

Vue.use(VueChartkick, { Chartkick })
And include on the page
<script src="https://www.gstatic.com/charts/loader.js"></script>
Highcharts
Run
yarn add highcharts
And add
import Chartkick from 'chartkick'
import VueChartkick from 'vue-chartkick'
import Highcharts from 'highcharts'

window.Highcharts = Highcharts
Vue.use(VueChartkick, { Chartkick })
Without Yarn or NPM
Include the charting library
<script src="https://unpkg.com/[email protected]/dist/Chart.bundle.js"></script>
And then the Chartkick libraries
<script src="https://unpkg.com/[email protected]"></script>
<script src="https://unpkg.com/[email protected]/dist/vue-chartkick.js"></script>
Example
<div id="app">
  <line-chart :data="chartData"></line-chart>
</div>

<script>
  var app = new Vue({
    el: "#app",
    data: {
      chartData: [["Jan", 4], ["Feb", 2], ["Mar", 10], ["Apr", 5], ["May", 3]]
    }
  })
</script>