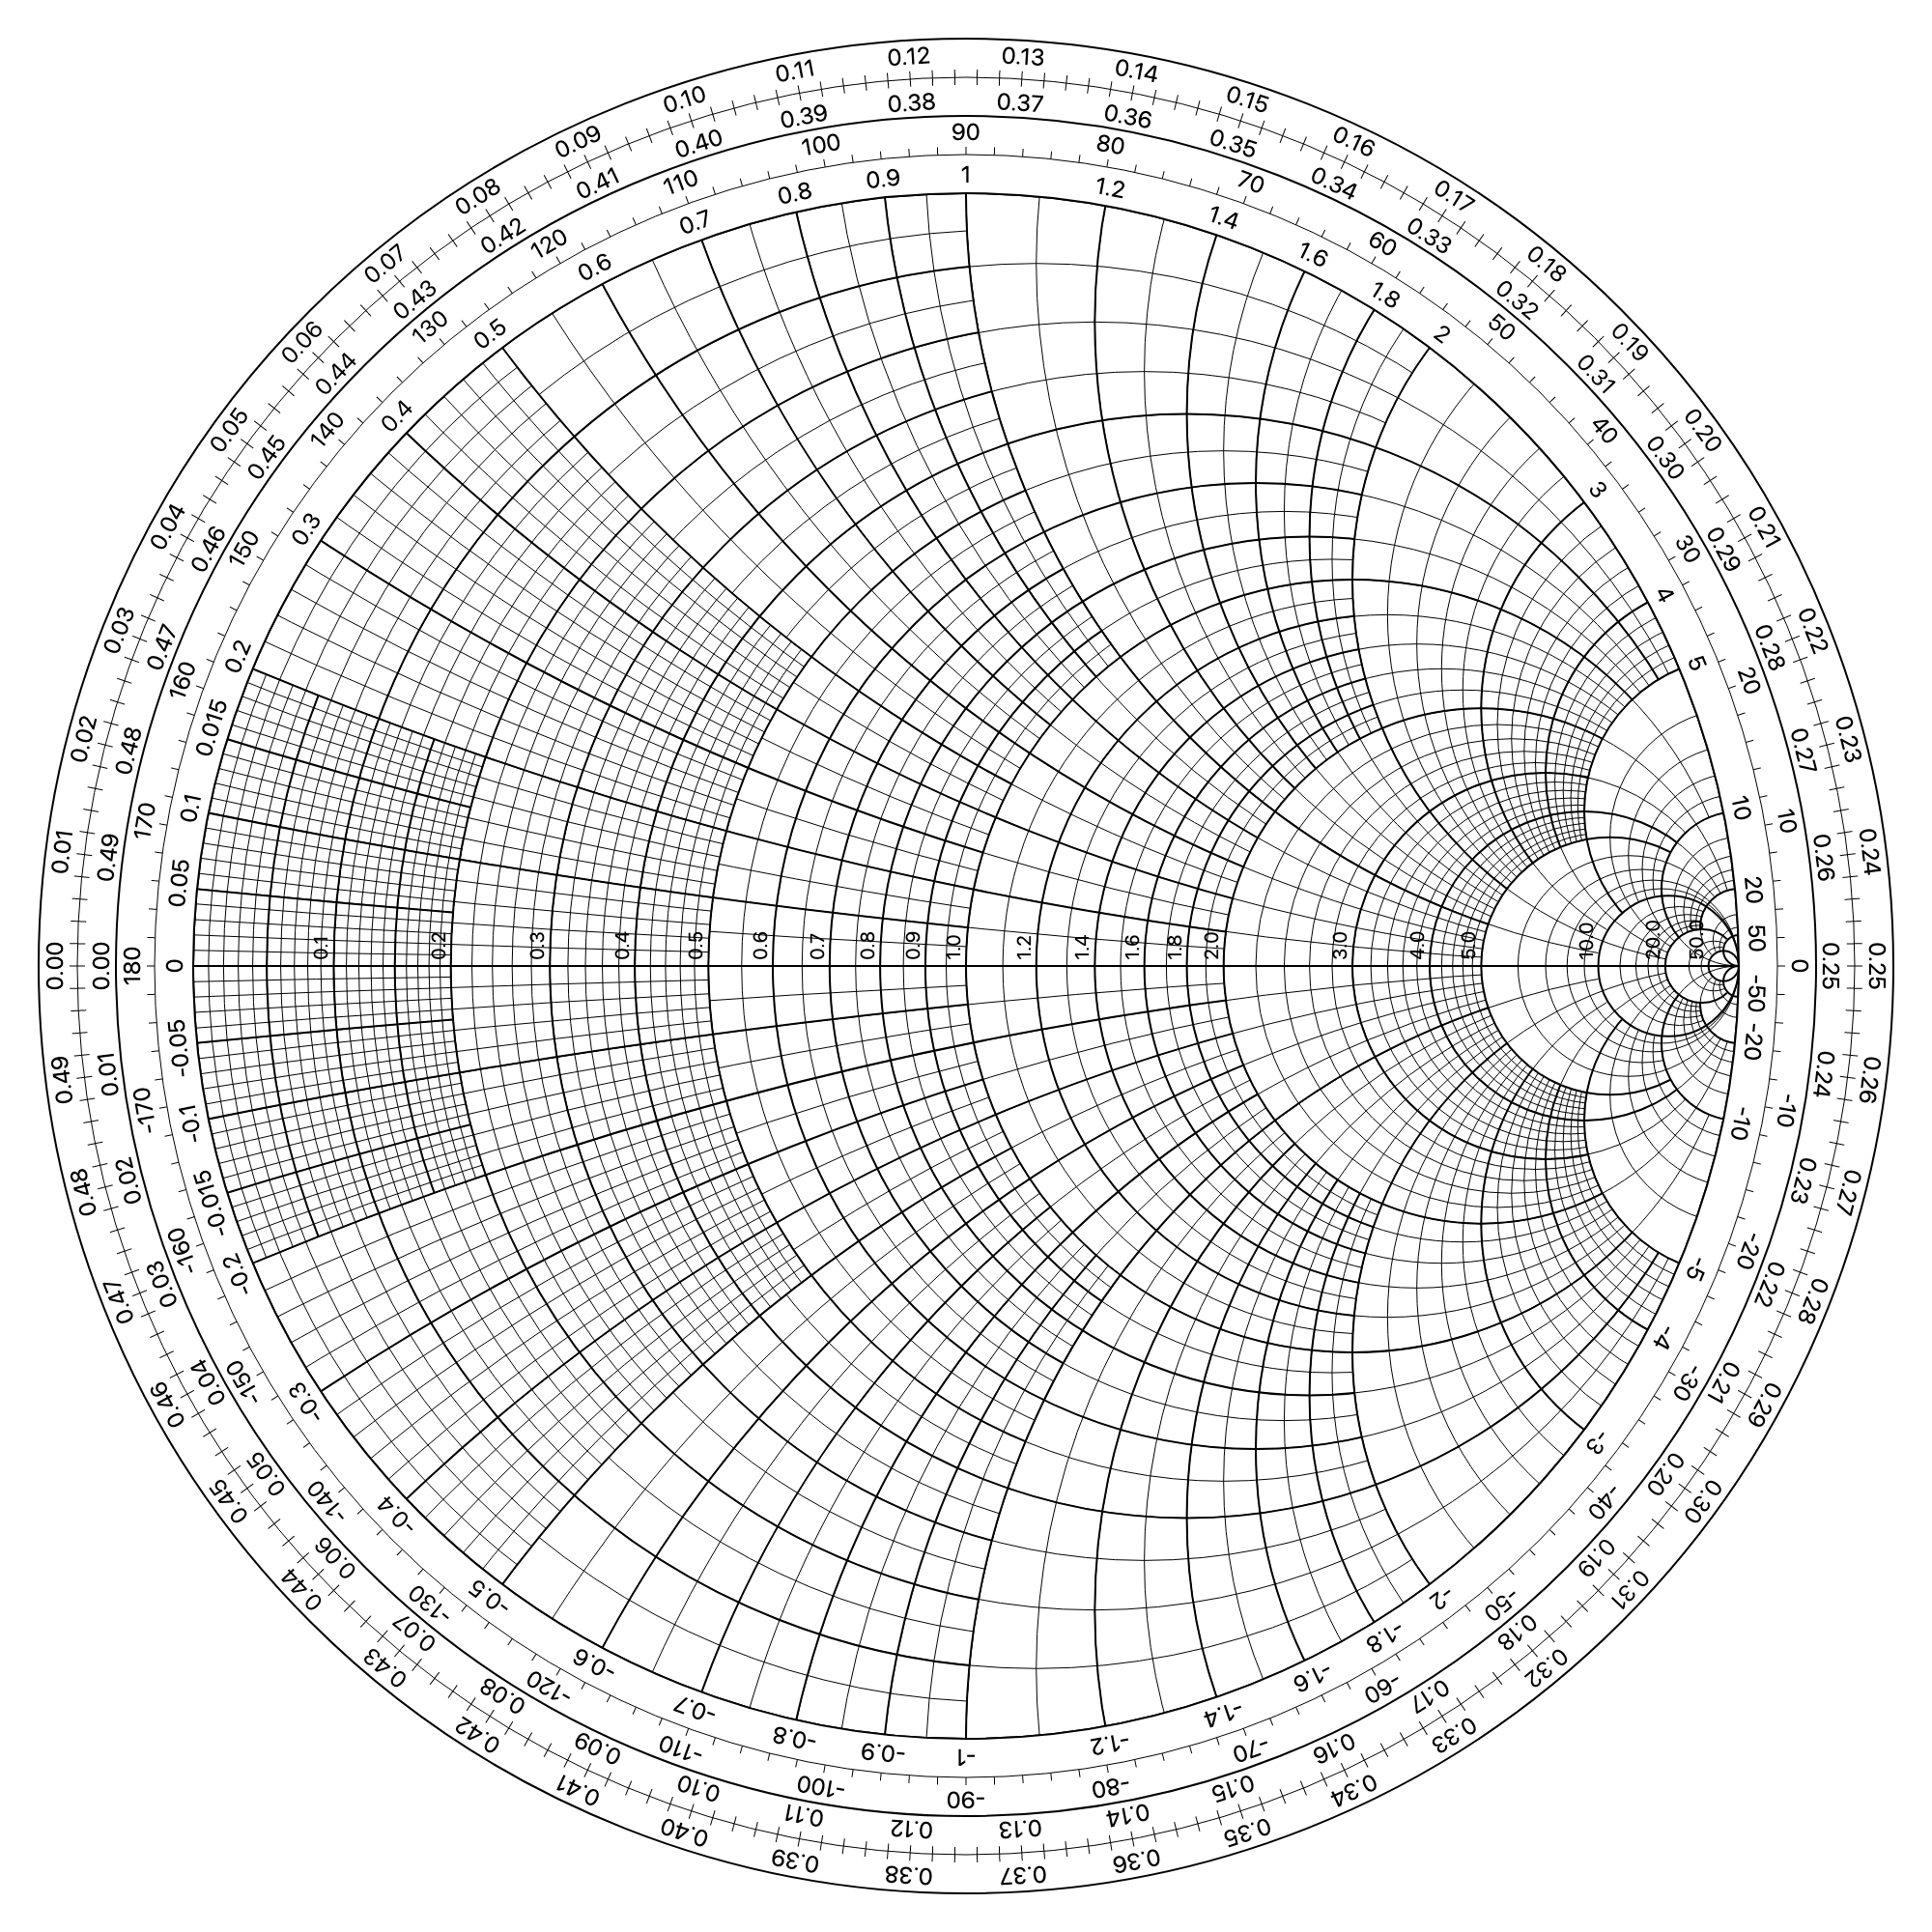
Smith Chart with Vue.js
The Smith Chart is a graphical aid or nomogram designed for electrical and electronics engineers specializing in radio frequency (RF) engineering to assist in solving problems with transmission lines and matching circuits
Assumed knowledge
This package is build with Vue.js. It's assumed you know how Vue.js works, and particularly, how components work in the Vue.js framework.
If you're not familiar with those terms, read the Vue.js documentation before moving forward in this document.
Getting Started
Source files are available in the /src folder as SFC (Single File Components).
To import the Smith Chart package as a global component, load the .js file in the /dist folder:
<script src="dist/smithChart.umd.js"></script>
Usage
After loading Vue.js library and the smithChart component js file, declare smithChart as a component in your Vue instance.
Load also the smithChart.css file for a bit of styling.
You can now use the <smith-chart> component inside your Vue app:
<!doctype html>
<html lang="en">
  <head>
    <meta charset="utf-8">
    <!-- Load the CSS file for a bit of styling, mostly labels -->
    <link rel="stylesheet" href="dist/smithChart.css">
    <title>Smith Chart with Vue.js - by Germinal Camps</title>
  </head>
  <body>

    <div id="app">
      <smith-chart></smith-chart>
    </div>

    <!-- Load Vue.js from a CDN or your local project -->
    <script src="https://unpkg.com/vue"></script>
    <!-- Load the SmithChart component JS file -->
    <script src="dist/smithChart.umd.js"></script>
    <!-- Instantiate your main Vue.js object -->
    <script>
    new Vue({
      components: {
        smithChart
      }
    }).$mount('#app')
    </script>
  </body>
</html>
Examples
Basic chart with <smith-chart>
Use the <smith-chart> component to draw the Smith Chart. Default SVG canvas size is 1000x1000px.
<smith-chart></smith-chart>
Options (via props)
:radius
- Type:
Number - Default:
400
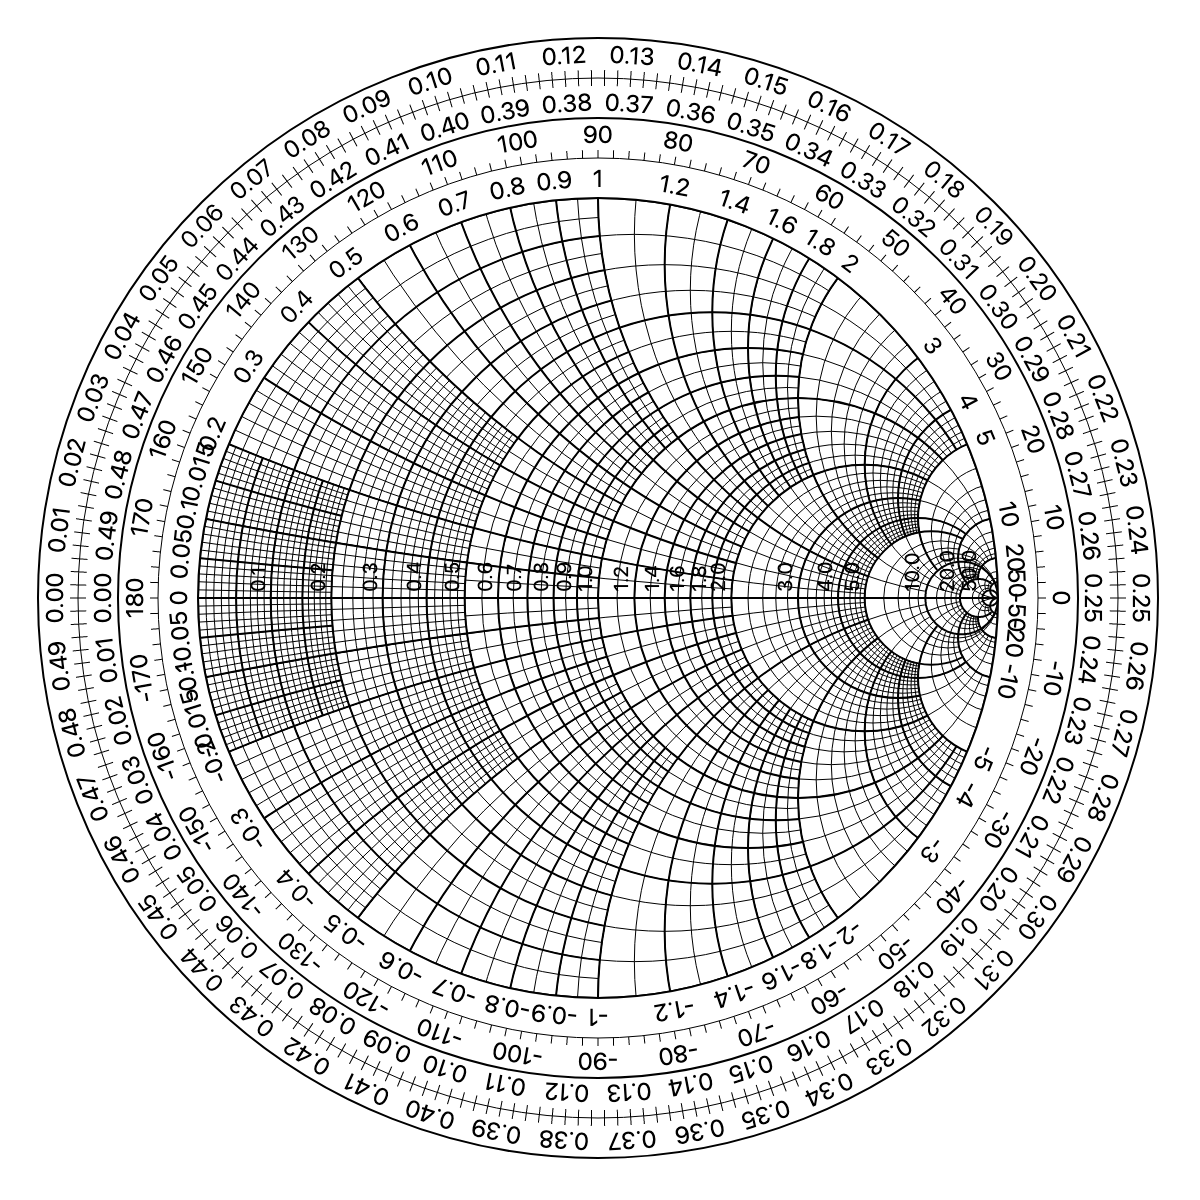
Define the radius of the chart in pixels. This prop sets the radius of the inner chart (without the external rings for labels)
You can use smaller radius, but the chart will look small and there won't be much space for labels
<smith-chart :radius="200"></smith-chart>
:label-rings
- Type:
Boolean - Default:
true
Show or hide the exterior label rings
<smith-chart :label-rings="false"></smith-chart>
:resistance-labels
- Type:
Boolean - Default:
true
Show or hide the resistance labels
<smith-chart :resistance-labels="false"></smith-chart>
:reactance-labels
- Type:
Boolean - Default:
true
Show or hide the reactance labels
<smith-chart :reactance-labels="false"></smith-chart>
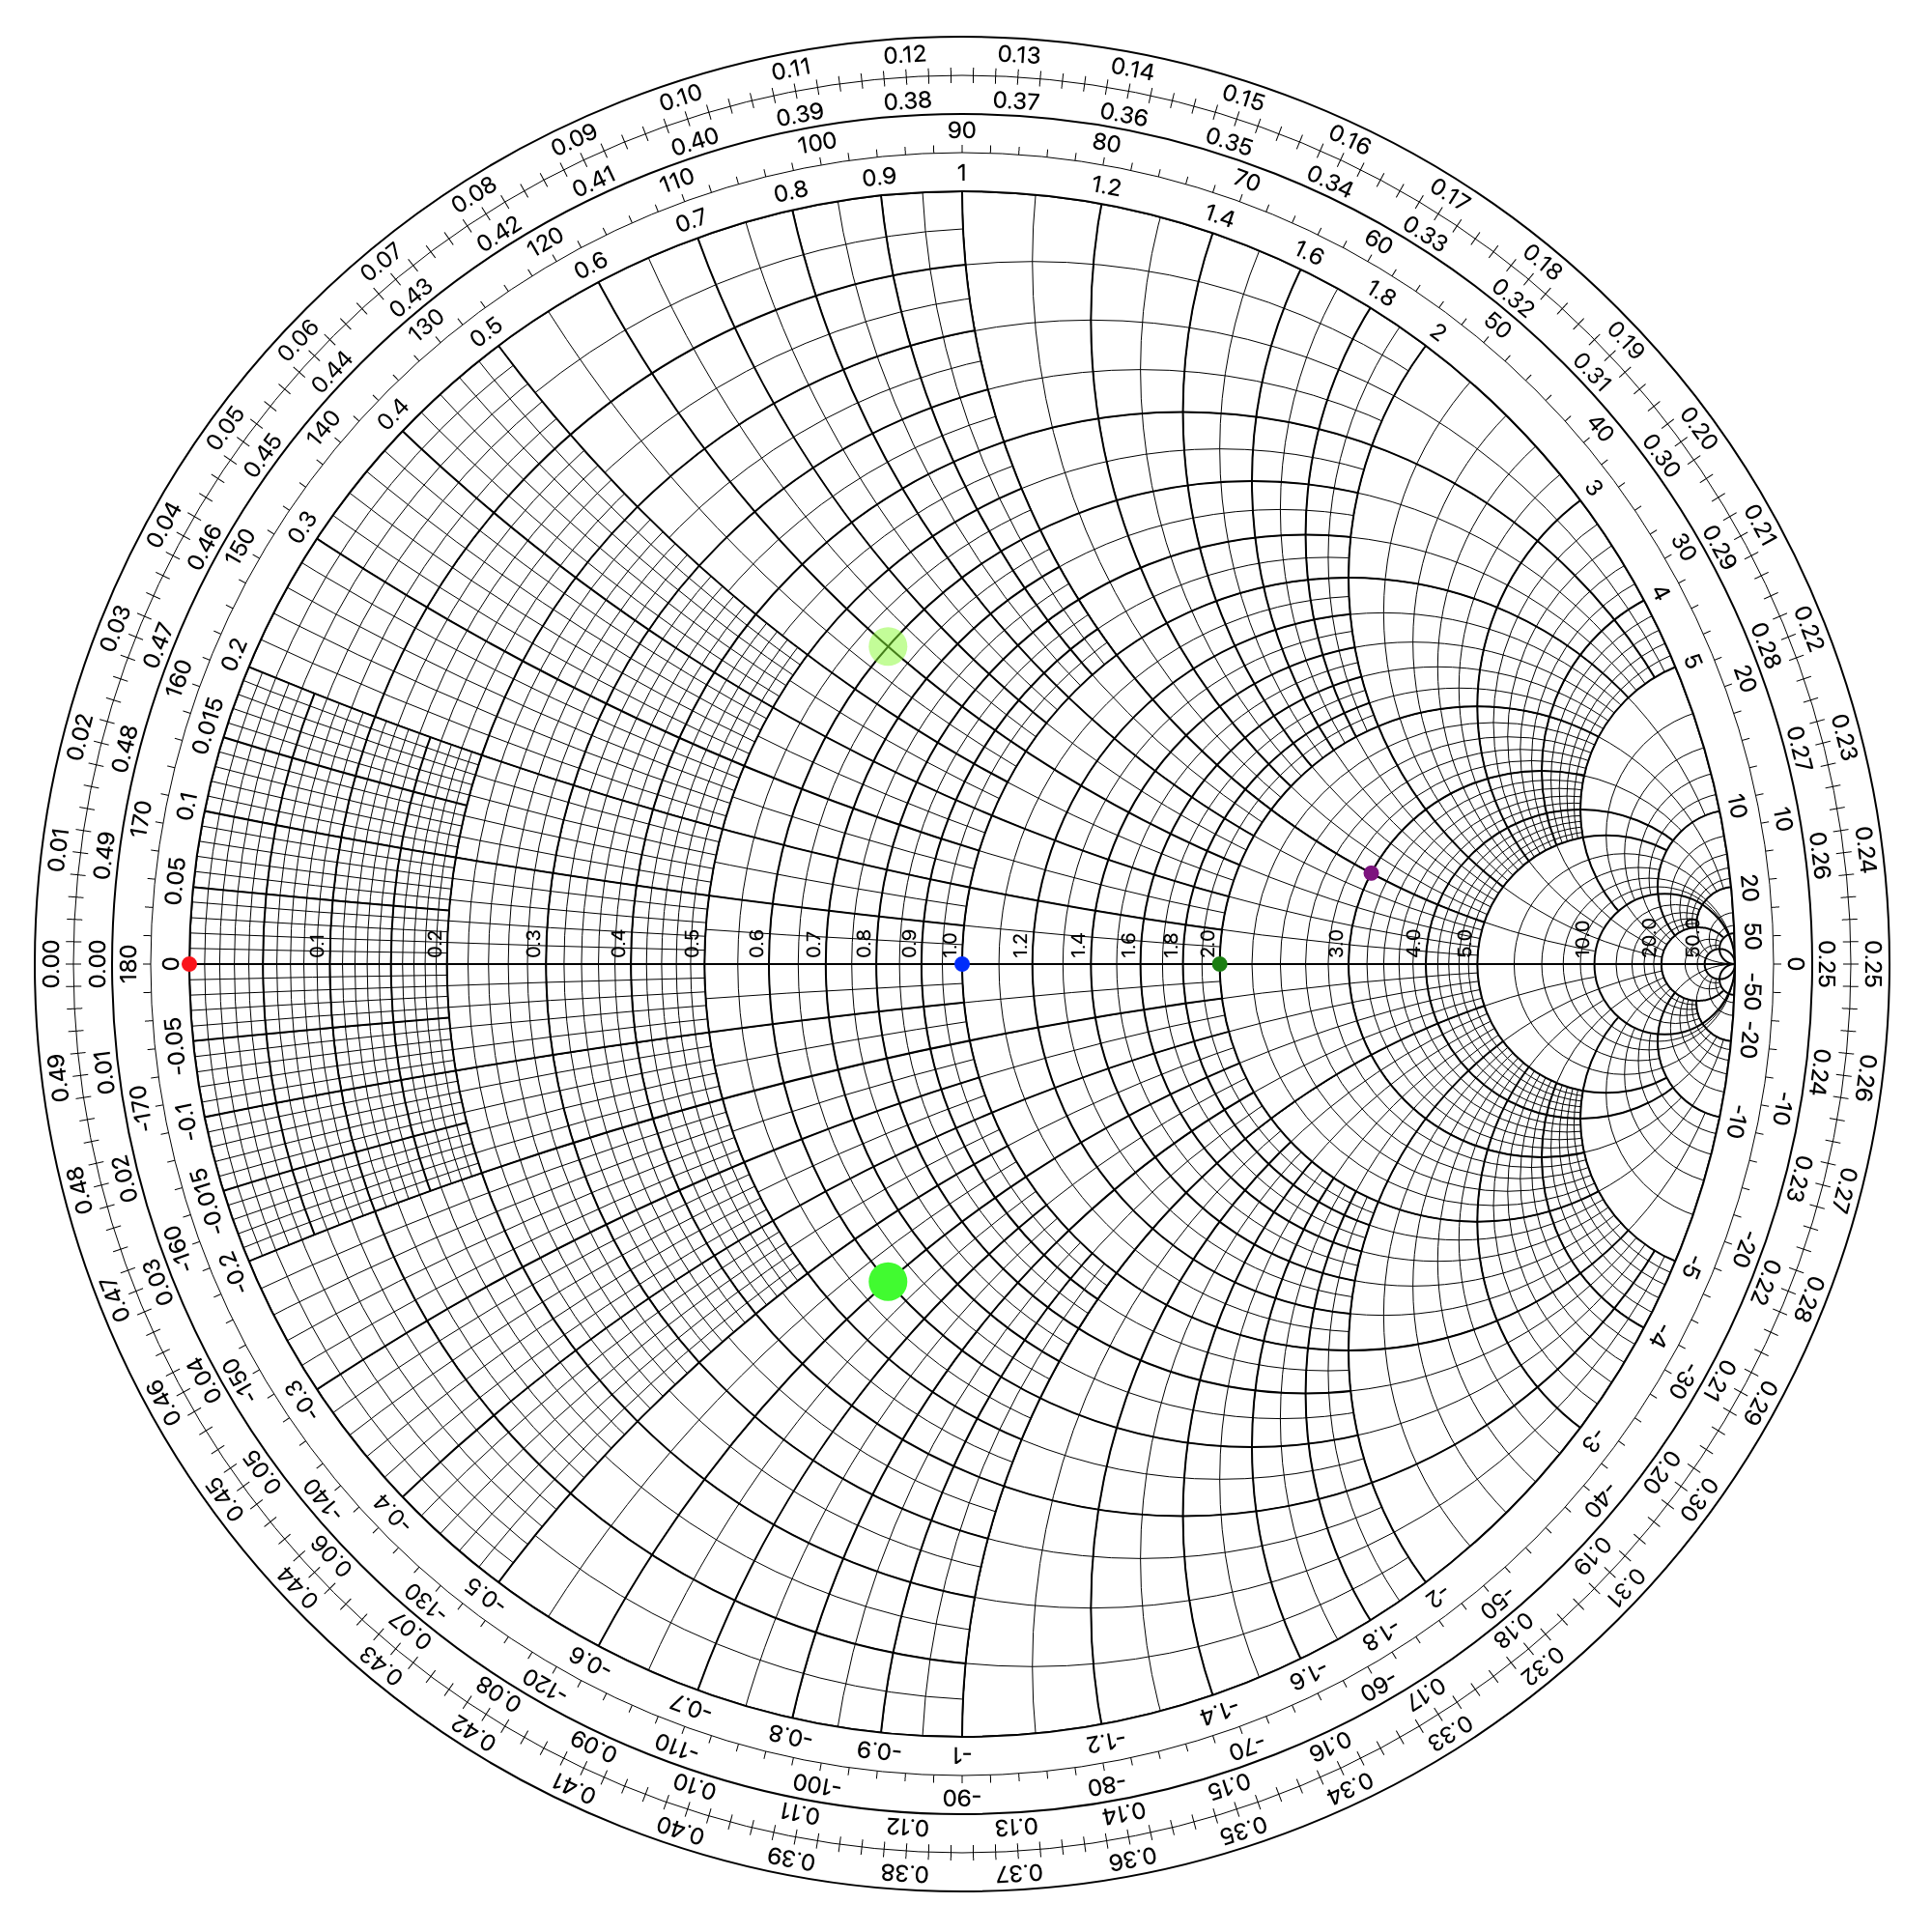
Draw points with <sm-point>
Use the <sm-point> component to draw points into specific intersecting resistance/reactance circles.
You need to specify the res and react props (resistance and reactance).
This will draw an SVG <circle> element at the desired position, which means all of the SVG attributes in HTML are still valid, such as fill to set the color. You can use r to set the radius of the point.
<smith-chart>
  <sm-point :res="0" :react="0" fill="red"></sm-point>
  <sm-point :res="1" :react="0" fill="blue"></sm-point>
  <sm-point :res="2" :react="0" fill="green"></sm-point>
  <sm-point :res="3" :react="1" fill="purple"></sm-point>
  <sm-point :res="0.6" :react="0.6" fill="rgba(123,345,2,0.5)" r="10"></sm-point>
</smith-chart>
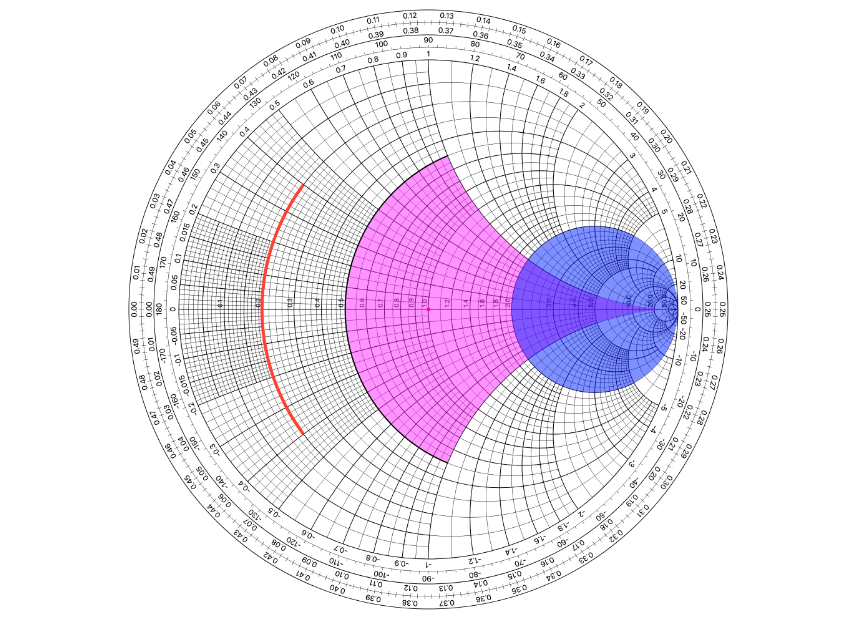
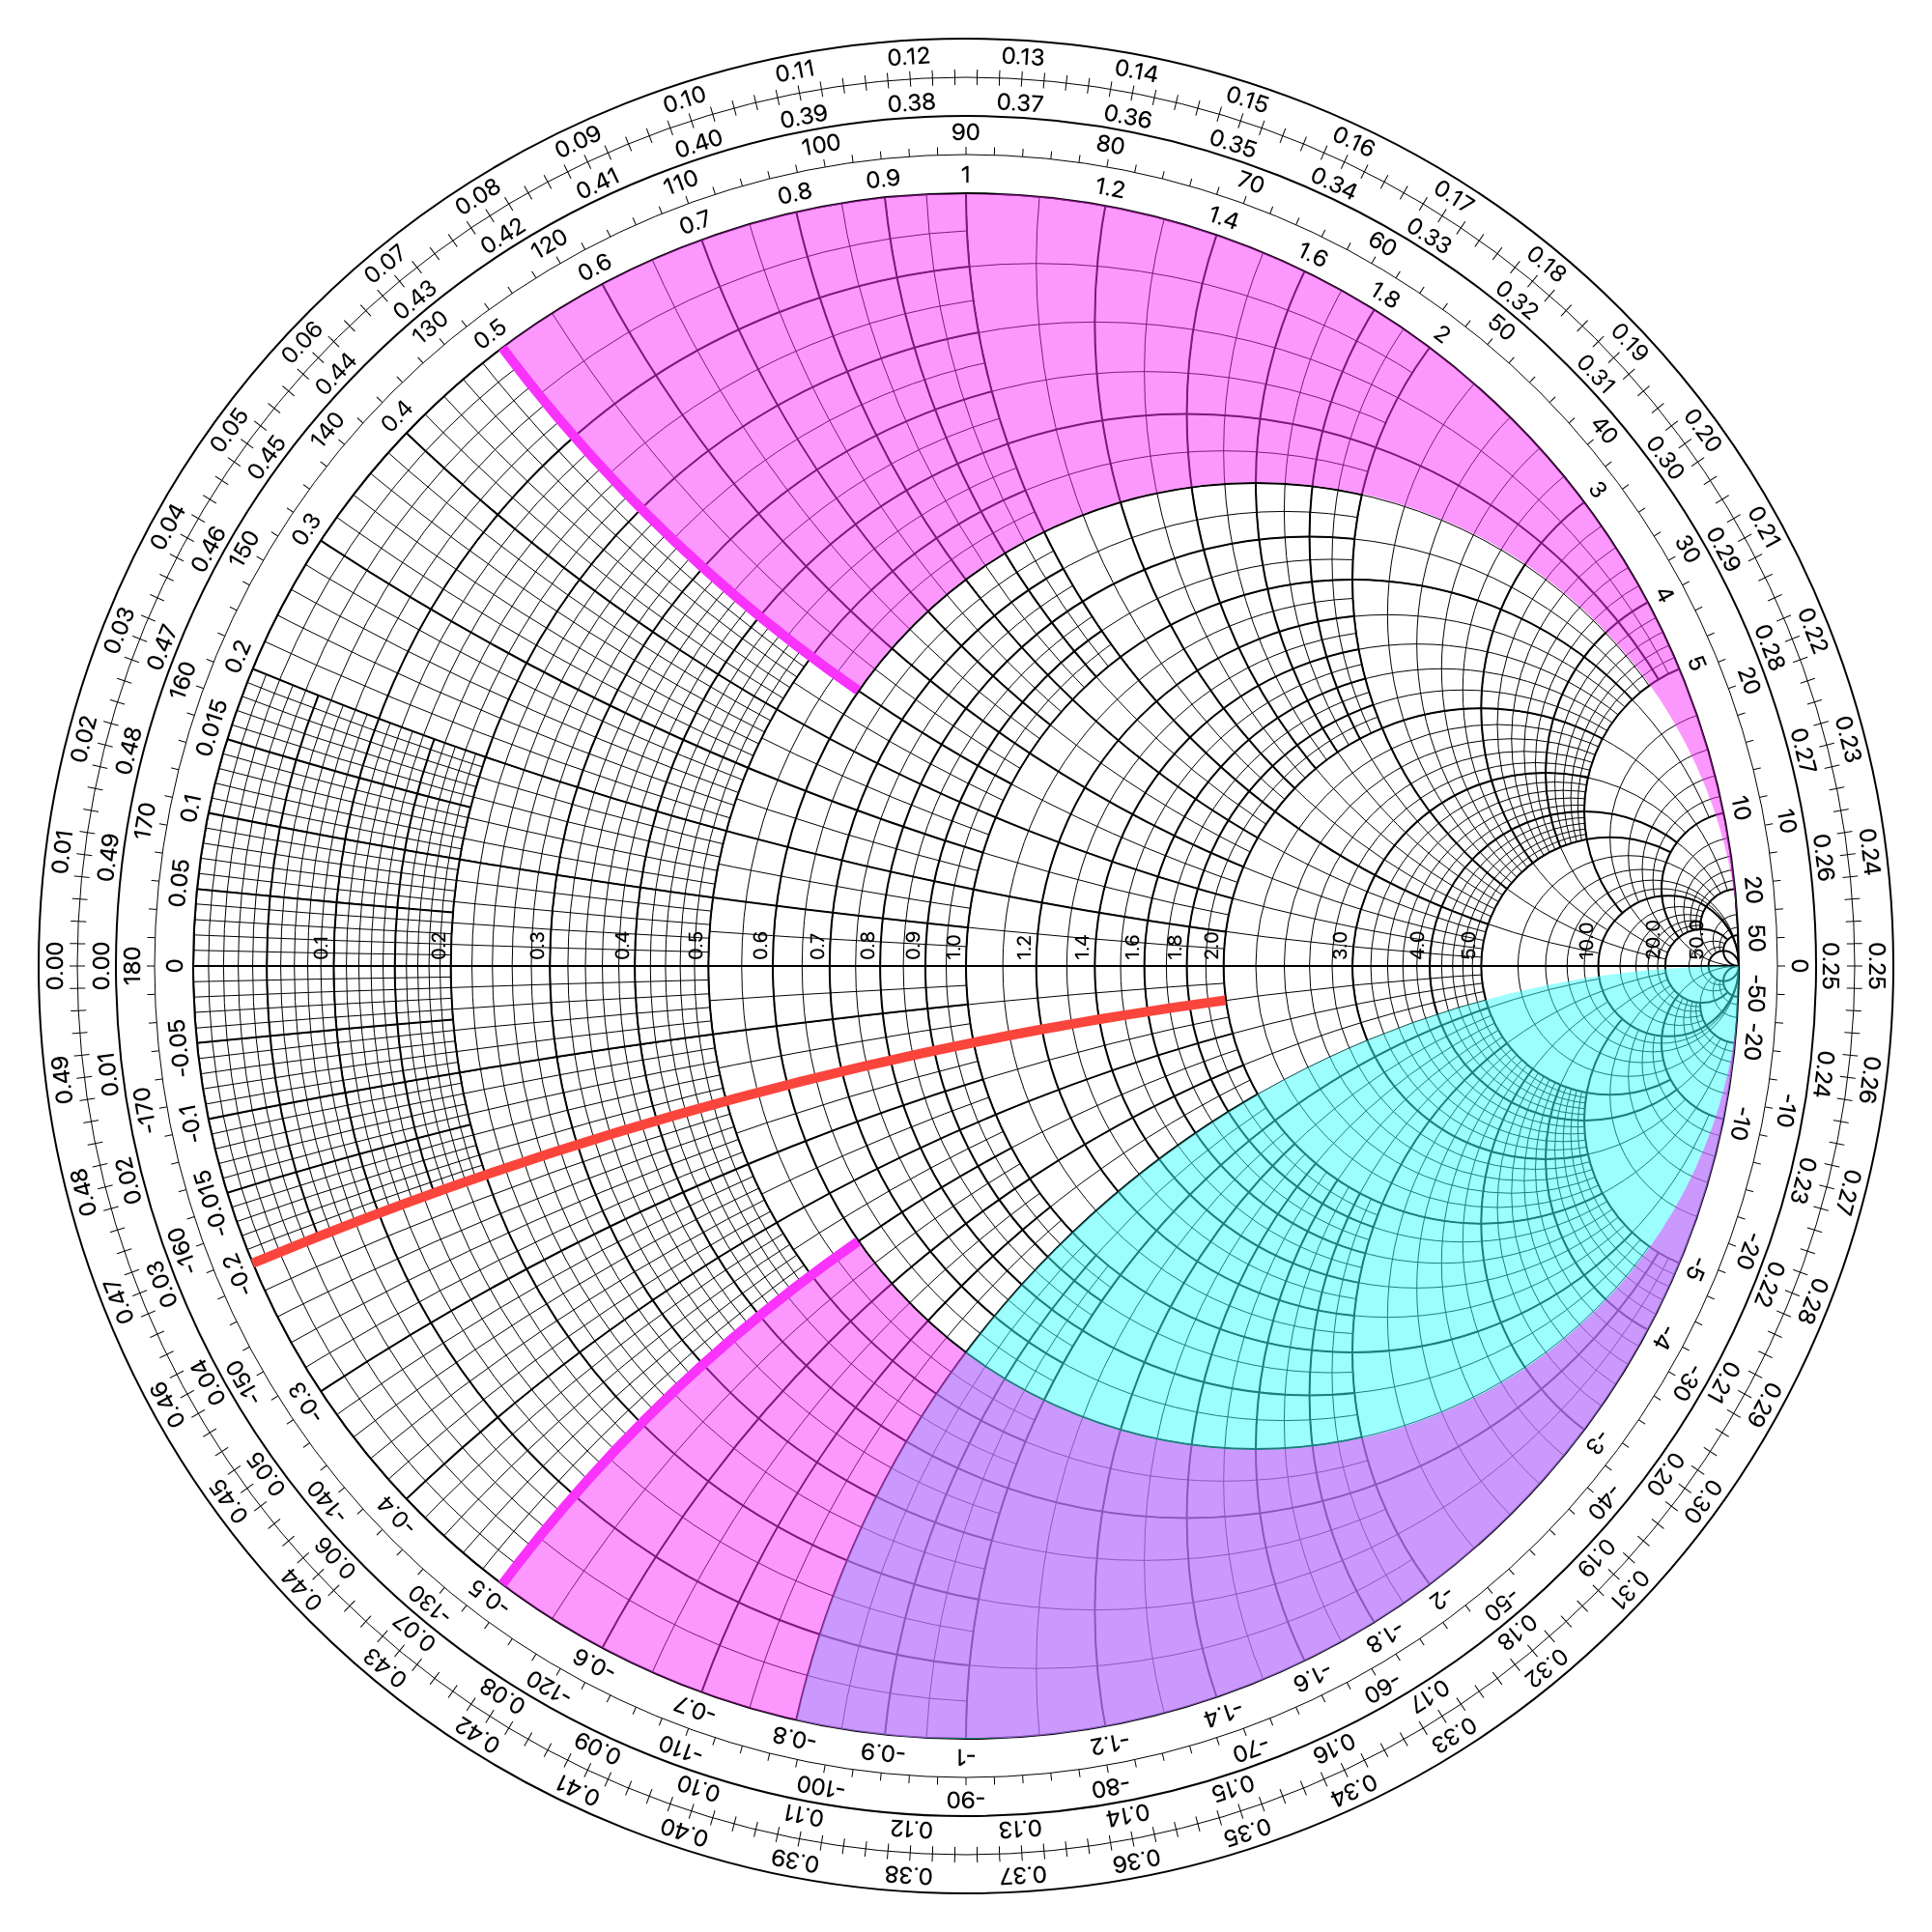
Draw Constant Resistance Circles with <sm-res-circle>
Use the <sm-res-circle> component to draw constant resistance circles into the chart.
You need to specify the res prop (resistance).
Optionally set the crop prop. This will "crop" the circle using a mask and show you only the portion of that circle that falls "outside" the Constant Reactance Arc of the specified value.
Use the SVG attributes fill, stroke and stroke-width to style the circle.
<smith-chart>
  <sm-res-circle
    :res="2"
    fill="rgba(0,0,255,0.5)"
  ></sm-res-circle>

  <sm-res-circle
    :res="0.5"
    :crop="1"
    fill="rgba(255,0,255,0.5)"
    stroke-width="2"
    stroke="black"
  ></sm-res-circle>

  <sm-res-circle
    :res="0.2"
    :crop="0.4"
    fill="none"
    stroke-width="5"
    stroke="#FF4136"
  ></sm-res-circle>
</smith-chart>
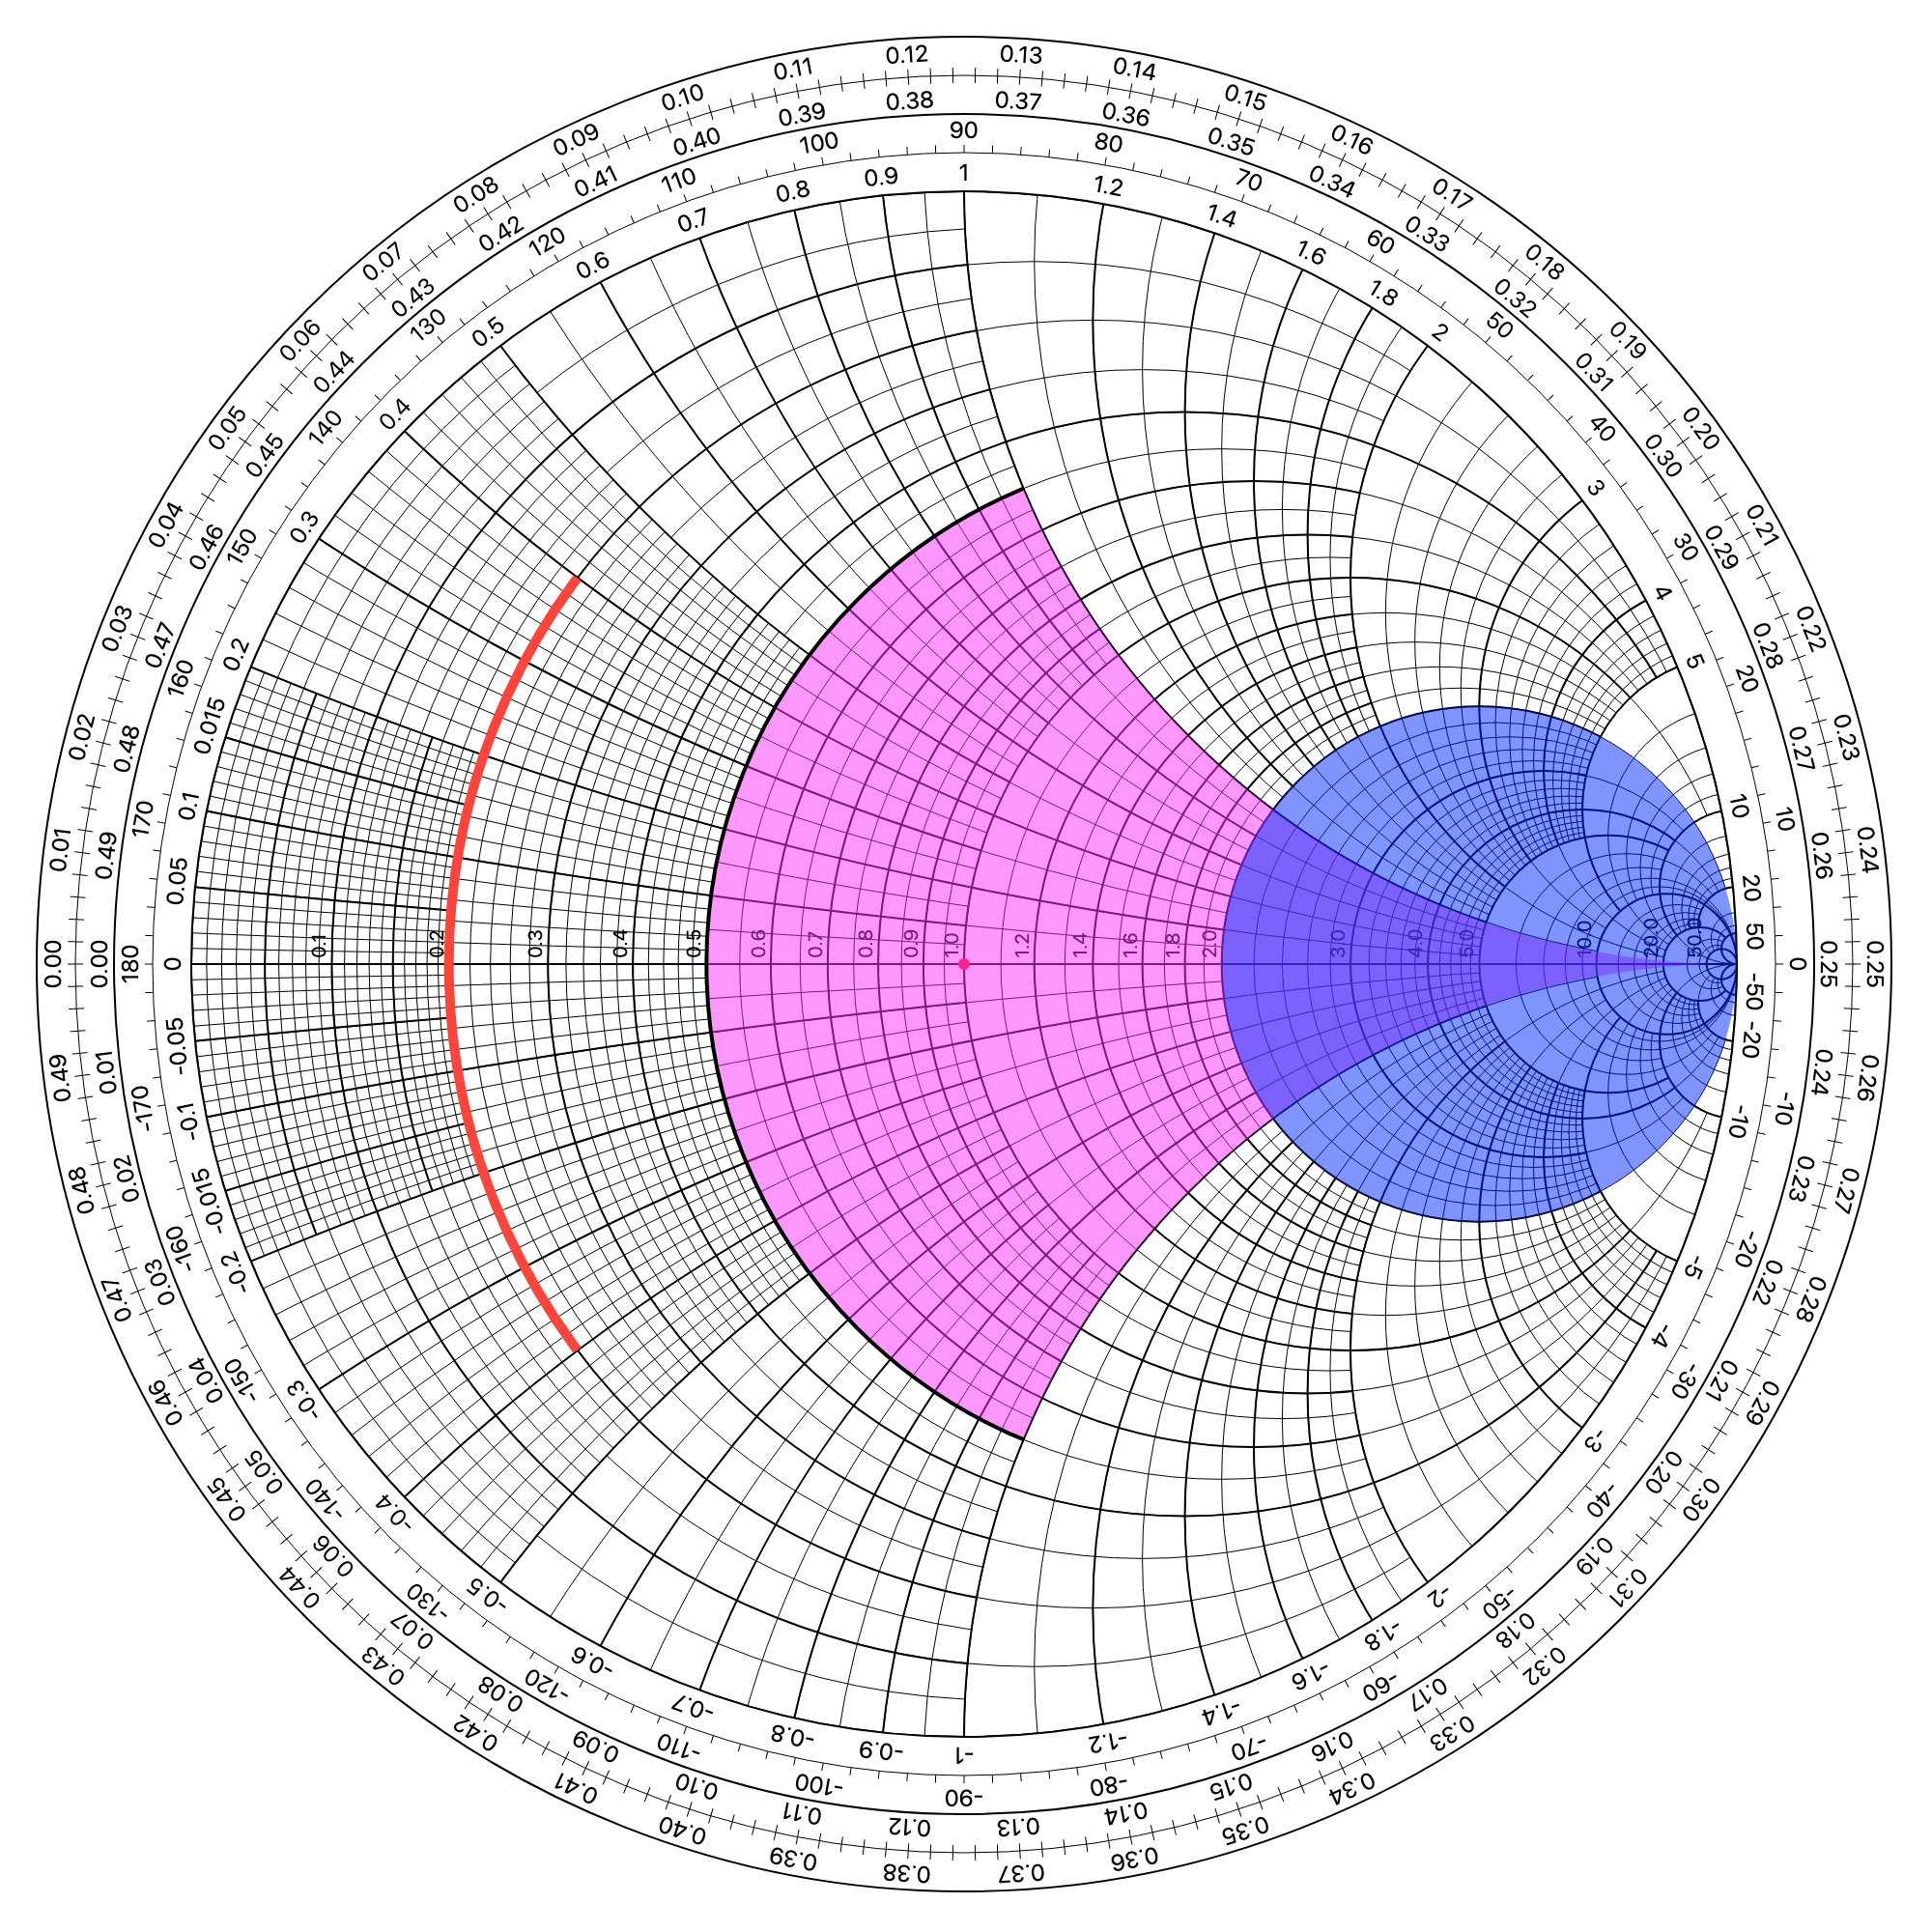
Draw Constant Reactance Arcs with <sm-react-arc>
Use the <sm-react-arc> component to draw constant reactance arcs into the chart.
You need to specify the react prop (reactance).
Optionally set the crop prop. This will "crop" the arc using a mask and show you only the portion of that arc that falls "outside" the Constant Resistance Circle of the specified value.
Optionally set the double prop to trueor false. This will draw the reactance arc and also its vertically simetric arc (eg. if you draw the 1 reactance arc, it will also draw the -1).
Use the SVG attributes fill, stroke and stroke-width to style the circle.
<smith-chart>
  <sm-react-arc
    :react="-0.2"
    :crop="2"
    fill="none"
    stroke-width="5"
    stroke="#FF4136"
  ></sm-react-arc>

  <sm-react-arc
    :react="-0.8"
    fill="rgba(0,255,255,0.5)"
  ></sm-react-arc>

  <sm-react-arc
    :react="0.5"
    :crop="0.6"
    :double="true"
    fill="rgba(255,0,255,0.5)"
    stroke-width="5"
    stroke="rgb(255,0,255)"
  ></sm-react-arc>
</smith-chart>
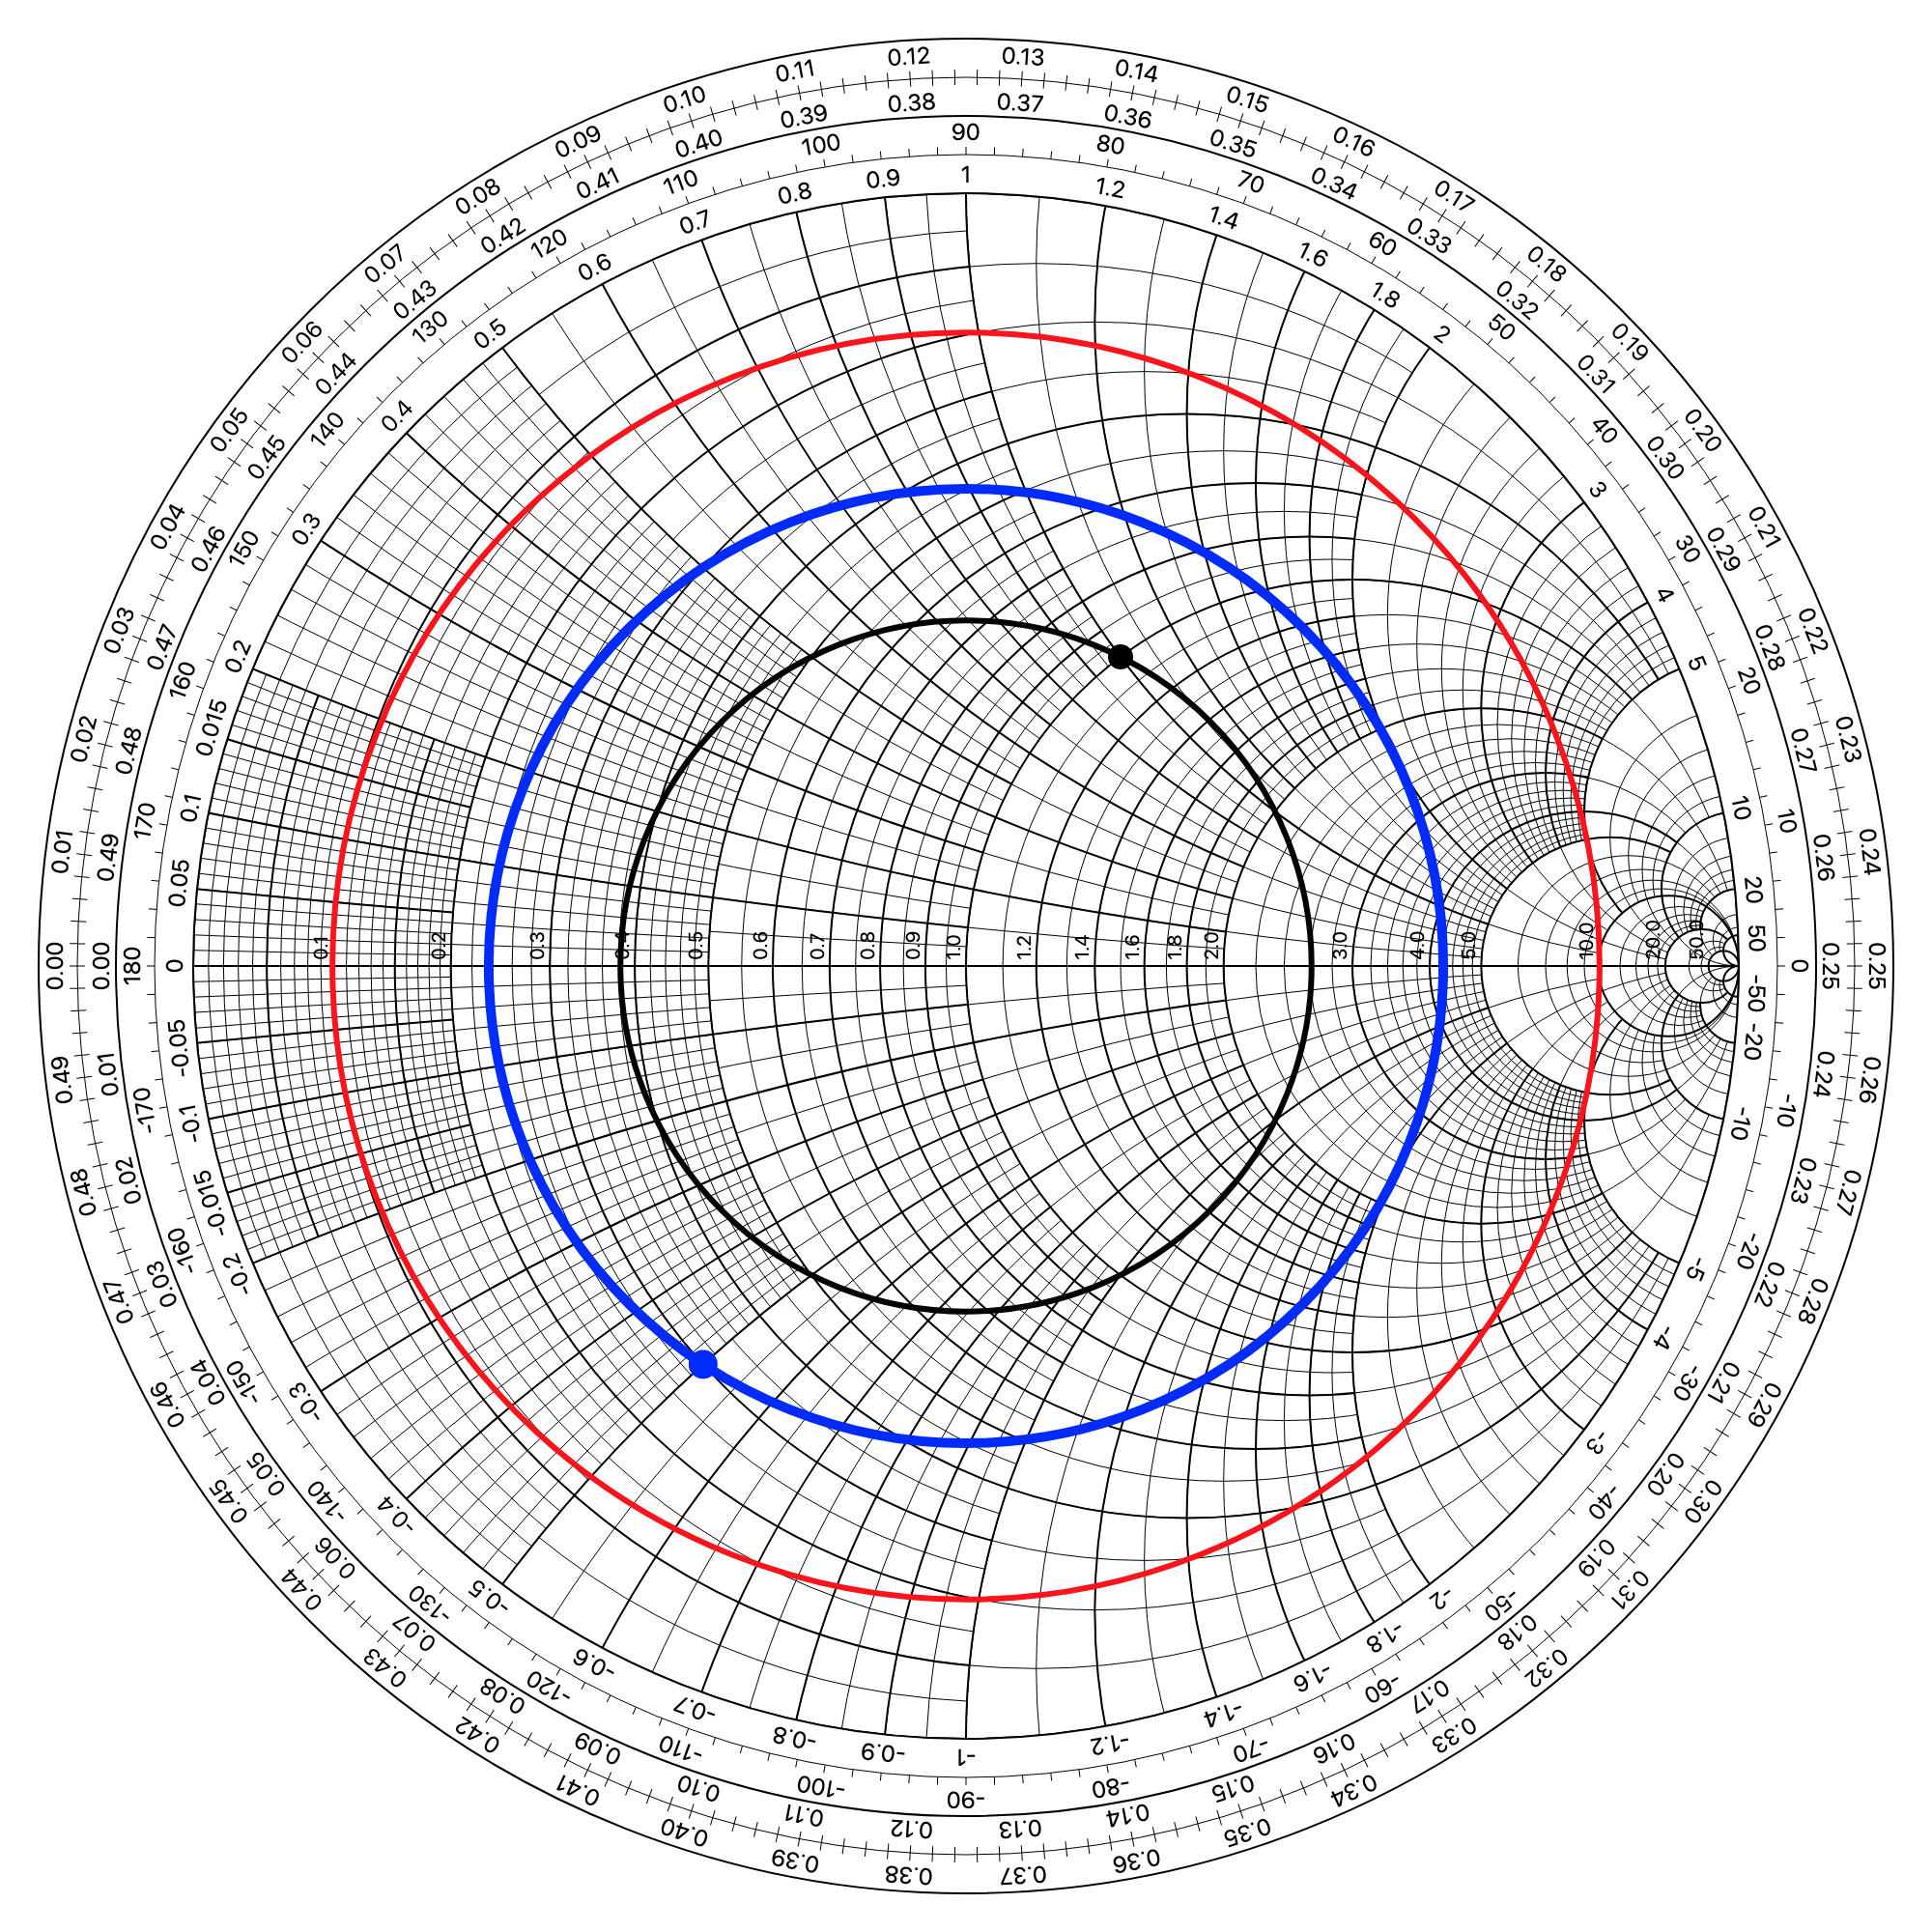
Draw Constant VSWR Circles with <sm-vswr-circle>
Use the <sm-vswr-circle> component to draw constant Voltage Standing Wave Ratio arcs into the chart.
You need to specify the res and react props (resistance and reactance) of the impedance from which you want to draw its VSWR.
The impedance point will be drawn as well, as a default option. Set the show-point prop to false if you don't want to display this point.
Use the SVG attributes stroke and stroke-width to style the circle.
<smith-chart>
  <sm-vswr-circle
    :res="1"
    :react="1"
  ></sm-vswr-circle>

  <sm-vswr-circle
    :res="0.3"
    :react="-0.5"
    stroke-width="5"
    stroke="blue"
  ></sm-vswr-circle>

  <sm-vswr-circle
    :res="0.2"
    :react="1"
    :show-point="false"
    stroke="red"
  ></sm-vswr-circle>
</smith-chart>
Authors
- Germinal Camps