vue-svg-charts
Lightweight Vue components for drawing pure svg charts without external dependencies.
Features
- Pure SVG. Vue is only used for calculations.
- No external dependencies
Installation
1. Install via yarn or npm
yarn add vue-svg-charts
OR
npm install vue-svg-charts
2. Import and use vue-svg-charts
- ES6
import BarGraph from "vue-svg-charts/components/bar";

Vue.use(BarGraph);
Usage
Basic usage
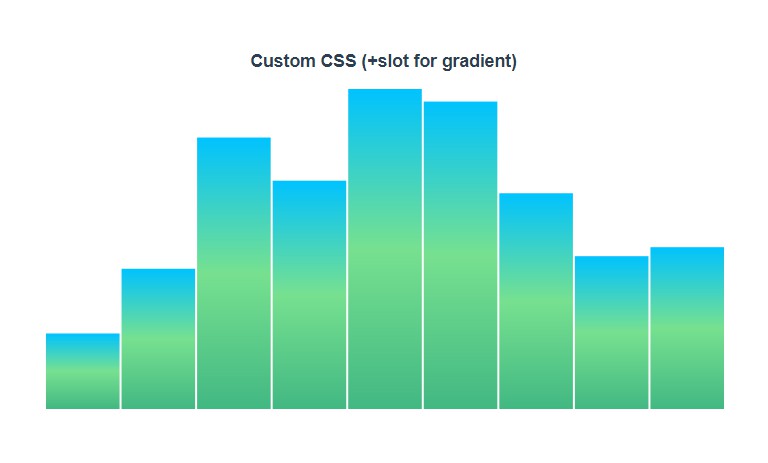
With sane defaults in place, basic usage is as simple as passing a points array of values bar-graph component.
<template>
  <bar-graph :points="points"/>
</template>
<script>
  export default {
    data() {
      return {
        points: [42, 8, 15, 16, 23, 42, 4, 8, 15]
      };
    }
  };
</script>
Usage with all the available props
<template>
    <bar-graph
      title="Test Bar Graph"
      animDuration="1s"
      :showValues="true"
      :easeIn="true"
      :points="points"
      :labels="labels"
      :width="1024"
      :height="320"
    />
</template>
<script>
  export default {
    data() {
      return {
      points: [42, 8, 15, 16, 23, 42, 4, 8, 15],
      labels: [
        "Label 1",
        "Label 2",
        "Label 3",
        "Label 4",
        "Label 5",
        "Label 6",
        "Label 7",
        "Label 8",
        "Label 9"
      ]
      };
    }
  };
</script>
Props
width
- type:
Number - default:
680 - Width of the graph. Can be any positive value.
height
- type:
Number - default:
320 - Height of the graph. Can be any positive value.
title
- type:
String - default: ``
- Title to set for the graph (is display on hover).
points
- type:
Array - default:
[] - Values to display.
labels
- type:
Array - default:
[] - Lables related to values array.
showValues
- type:
Boolean - default:
false - Specifies whether the graph should display values on top of bar.
animated
- type:
Boolean - default:
true - Specifies whether the graph should be animated by transition.
animDuration
- type:
String - default:
1s - SVG animation duration.
