trading-charts
Example Vue.js website demonstrating how to listen to the Binance Websocket server and trade charts using d3.js.
Demo
⚡️ https://adrianmanchev.github.io/trading-charts
Shortcodes
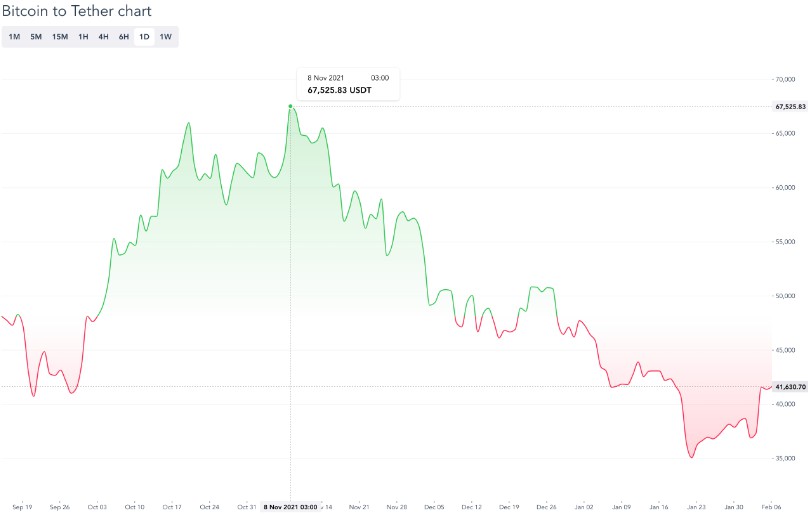
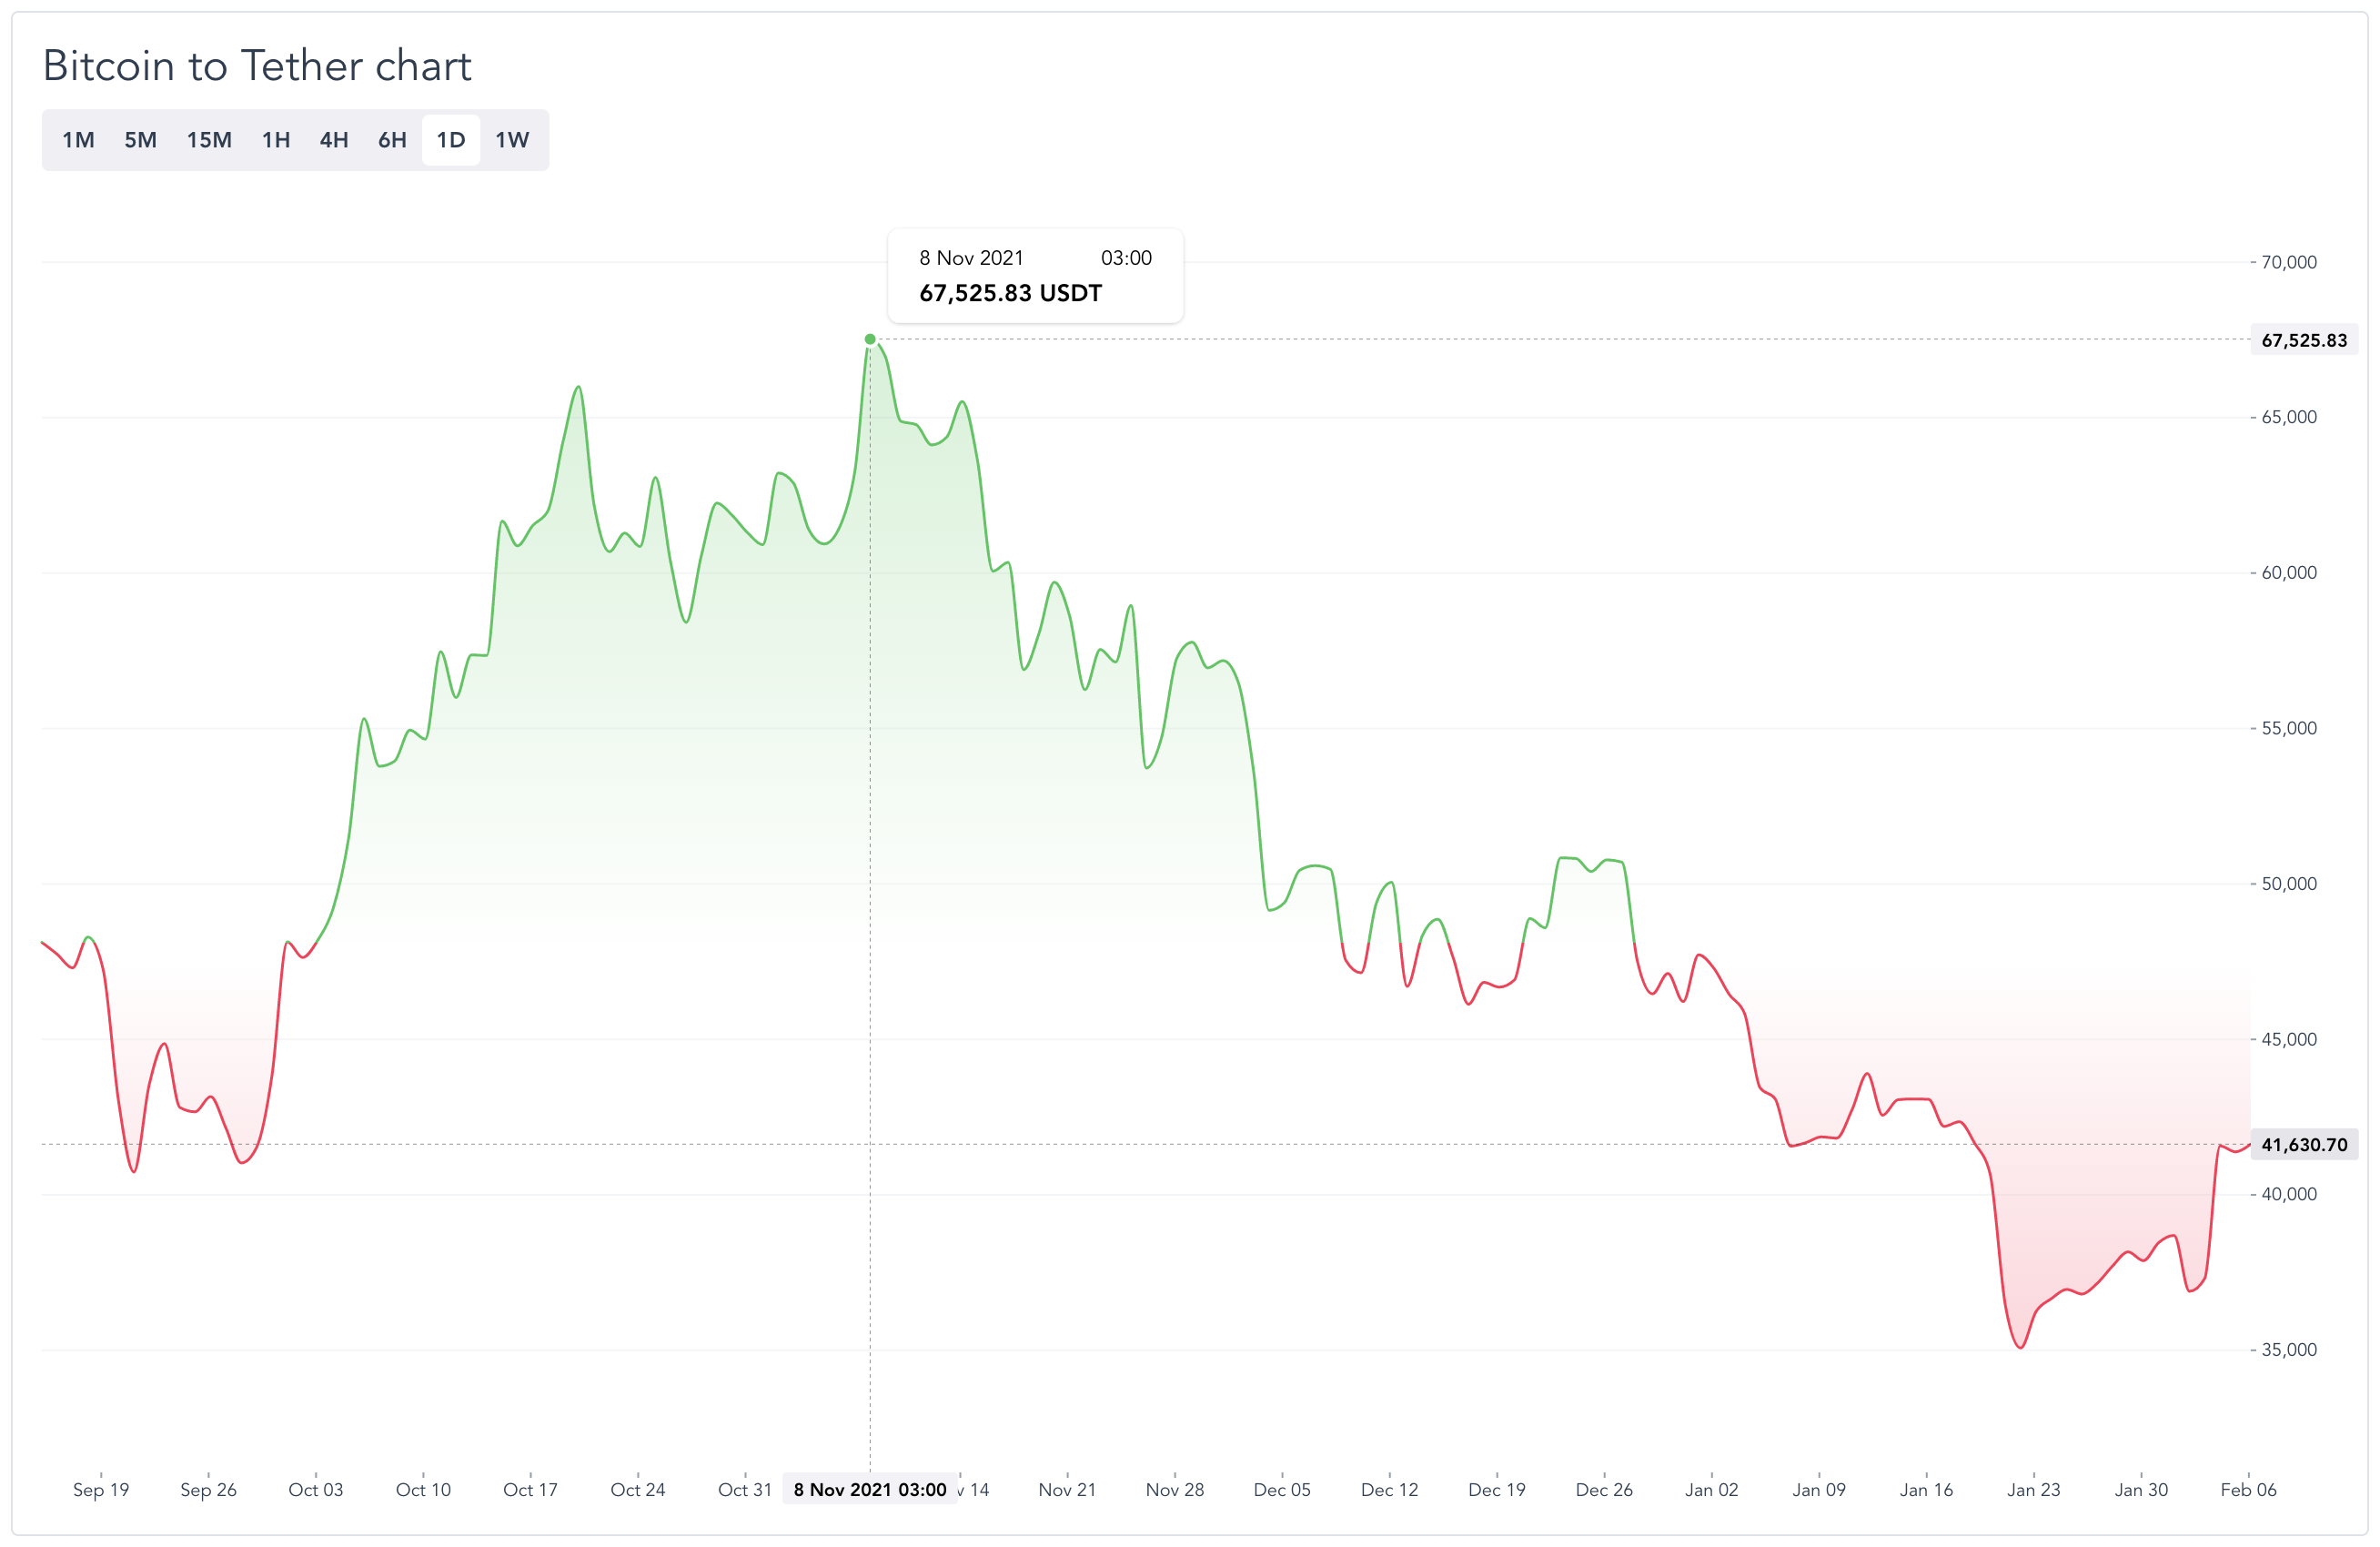
D3
Create a line chart with historical close prices for the time series and change the tick price.
import chart from '@/helpers/chart'

const draw = chart(data, {
  width: 960
})

draw.update(price)
Binance
Request historical klines data for a certain symbol over a specified time period. For drawing line charts inside payload data, use time and close price.
import axios from 'axios'

const instance = axios.create(
  baseURL: 'https://api.binance.com',
  headers: {
    Accept: 'application/json',
    'Content-Type': 'application/json'
  }
})

const klines = instance({
  method: 'get',
  url: '/api/v3/klines',
  params: {
    symbol: 'BTCUSDT',
    interval: '15m'
  }
})
Project setup
npm install
Compiles and hot-reloads for development
npm run serve
Compiles and minifies for production
npm run build
Lints and fixes files
npm run lint