HMI – Data Visualization
Use the app · Demo on Google Drive
To install the app
Download the source code :
git clone
Start a terminal in the project’s folder then install the dependencies :
npm install
Compile and launch the app on localhost:8080 :
npm run serve
Project’s description
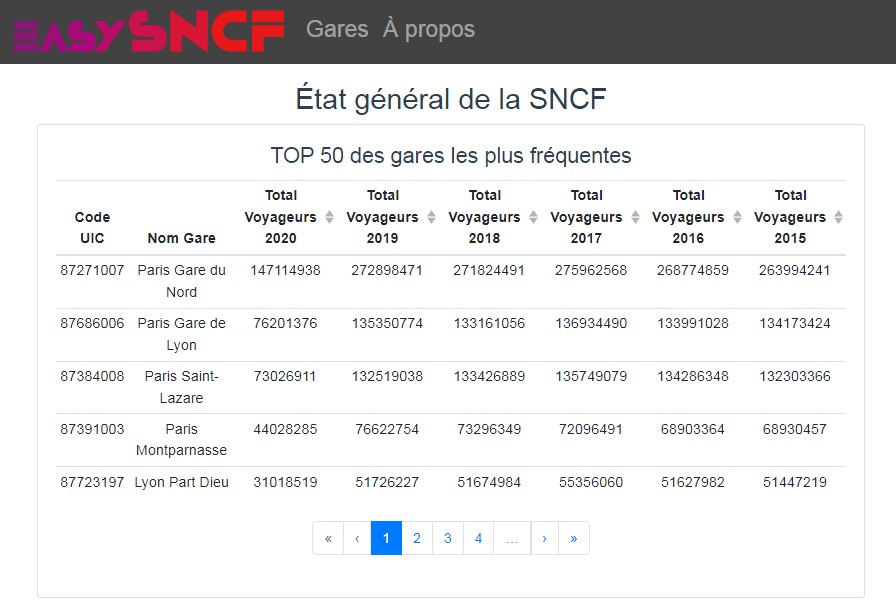
This project deals primarily with train stations in France, giving details and insights about each one of them.
We therefore in a home page display two tables, train stations ranked by affluence in a first table,
while the second ranks train stations based on a cleanliness index.
We, in the page named “Gares” have implemented a search engine. The user can type in the name of the
region, department, city or even the train station and get results in list along with corresponding positions on a map.
When a result is clicked, we then redirect to a page of details about the corresponding train station.
Details like waiting services in the station, the precentage of returned items and the cleanliness index are given and visualized
using Pie charts and Column charts.