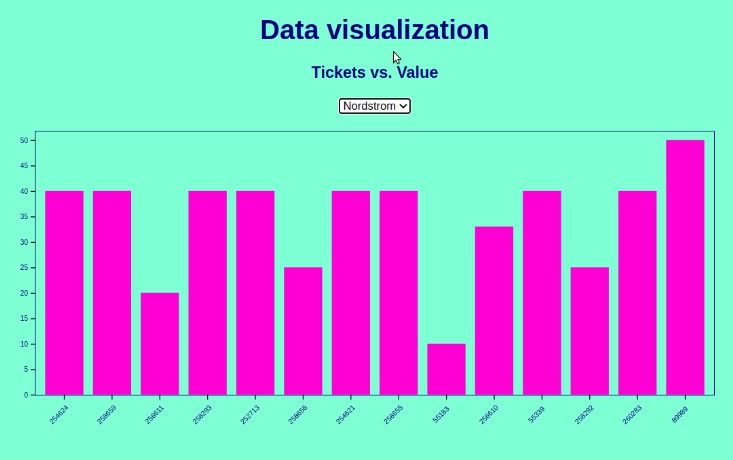
data_visualization
This project is an interactive Vue and D3.js app that fetches data from a JSON file and displays data on a Chart component (Vue), it includes a selector that allows the user to filter the required data displayed on the chart.
This is a dockerized app so you can launch using Docker

Launch with Docker
docker-compose up
Project setup
npm install
Compiles and hot-reloads for development
npm run serve
Compiles and minifies for production
npm run build
Lints and fixes files
npm run lint