Rocket BI
RocketBI is a self-service, web-based business intelligent product tailor-made for analytical databases. RocketBI is the core product of DataInsider
stack.
You can use RocketBI to analyze, visualize, and easily collaborate with your friends.
To learn more about DataInsider's stack and RocketBi's features, see our documentation.
Get started
Run RocketBI locally:
To try out RocketBI on your machine, the best way is using our pre-built Docker images.
Prerequisites:
- docker engine 19.0+
- docker-compose 2.0+
1. Prepare:
wget https://raw.githubusercontent.com/datainsider-co/rocket-bi/main/docker/docker-compose.yml

wget https://raw.githubusercontent.com/datainsider-co/rocket-bi/main/docker/.clickhouse.env
Edit .clickhouse.env with your clickhouse server's host, port, username, password and cluster name.
NOTE: If you're installing RocketBI on the same host with your clickhouse-server, please use 172.17.0.1 as your CLICKHOUSE_HOST instead of localhost for docker to resolve hosts correctly.
1.2. (Optional) Install sample clickhouse:
If you don't have clickhouse access at the moment, you can still try RocketBI by installing our sample clickhouse instance by running the following commands:
wget https://raw.githubusercontent.com/datainsider-co/rocket-bi/main/docker/sample_clickhouse_cluster.zip

unzip sample_clickhouse_cluster.zip

cd sample_clickhouse_cluster/

docker-compose up -d

./import_sample_data.sh

cd -
If the commands run successfully, you will have access to an instance of clickhouse cluster locally with the following information:
CLICKHOUSE_HOST: "172.17.0.1"
CLICKHOUSE_HTTP_PORT: 8123
CLICKHOUSE_TCP_PORT: 9000
CLICKHOUSE_USERNAME: default
CLICKHOUSE_PASSWORD: ""
CLICKHOUSE_CLUSTER_NAME: ""
2. Start RocketBI:
docker-compose up -d
3. Explore your data:
- Open browser and go to
localhost:5050to enter the web UI. - Login to RocketBI with this default account:
username: [email protected]
password: 123456
- Begin by creating a dashboard and using drag-n-drop tool to explore your data.
Build from source:
Server services:
Prerequisites:
- java 8
- maven 3
- mysql 5.7
- ssdb 1.9.9
There are 3 services that RocketBI relies on: bi-service, caas-service and schema-service.
To build a service:
cd <service_dir>

# install needed libraries:
./libs/install.sh

# build source:
mvn package

# config mysql and ssdb host/port (default port for mysql is localhost:3306 and for ssdb is localhost:8888):
vi conf/local.conf

# start service locally:
./runservice start local
Services will be start at specific port specify in conf/local.conf file. For example, the default http port for bi-service is 8080, to test if
bi-service is up and running, run:
curl localhost:8080/ping
To stop a service, run:
./runservice stop
Rocket-bi web UI:
Prerequisites:
- node v12.22.9
- yarn 1.22.19
Start building web client by running:
cd rocket-bi-web
yarn serve
Web will be served at port 8080.
Documentation
For the complete documentation visit datainsider.co.
Contribute
For contribution guidelines, see contributing.
Questions? Problems? Suggestions?
- To report a bug or request a feature, create a
Issue. Please make it easy for people to reproduce your issue.
Example:
Adhoc-Query: Using SQL to do complex analysis & visualise the result with just drag-n-drop for a clear perspective. There are also supported functions & autocompletion for SQL query.

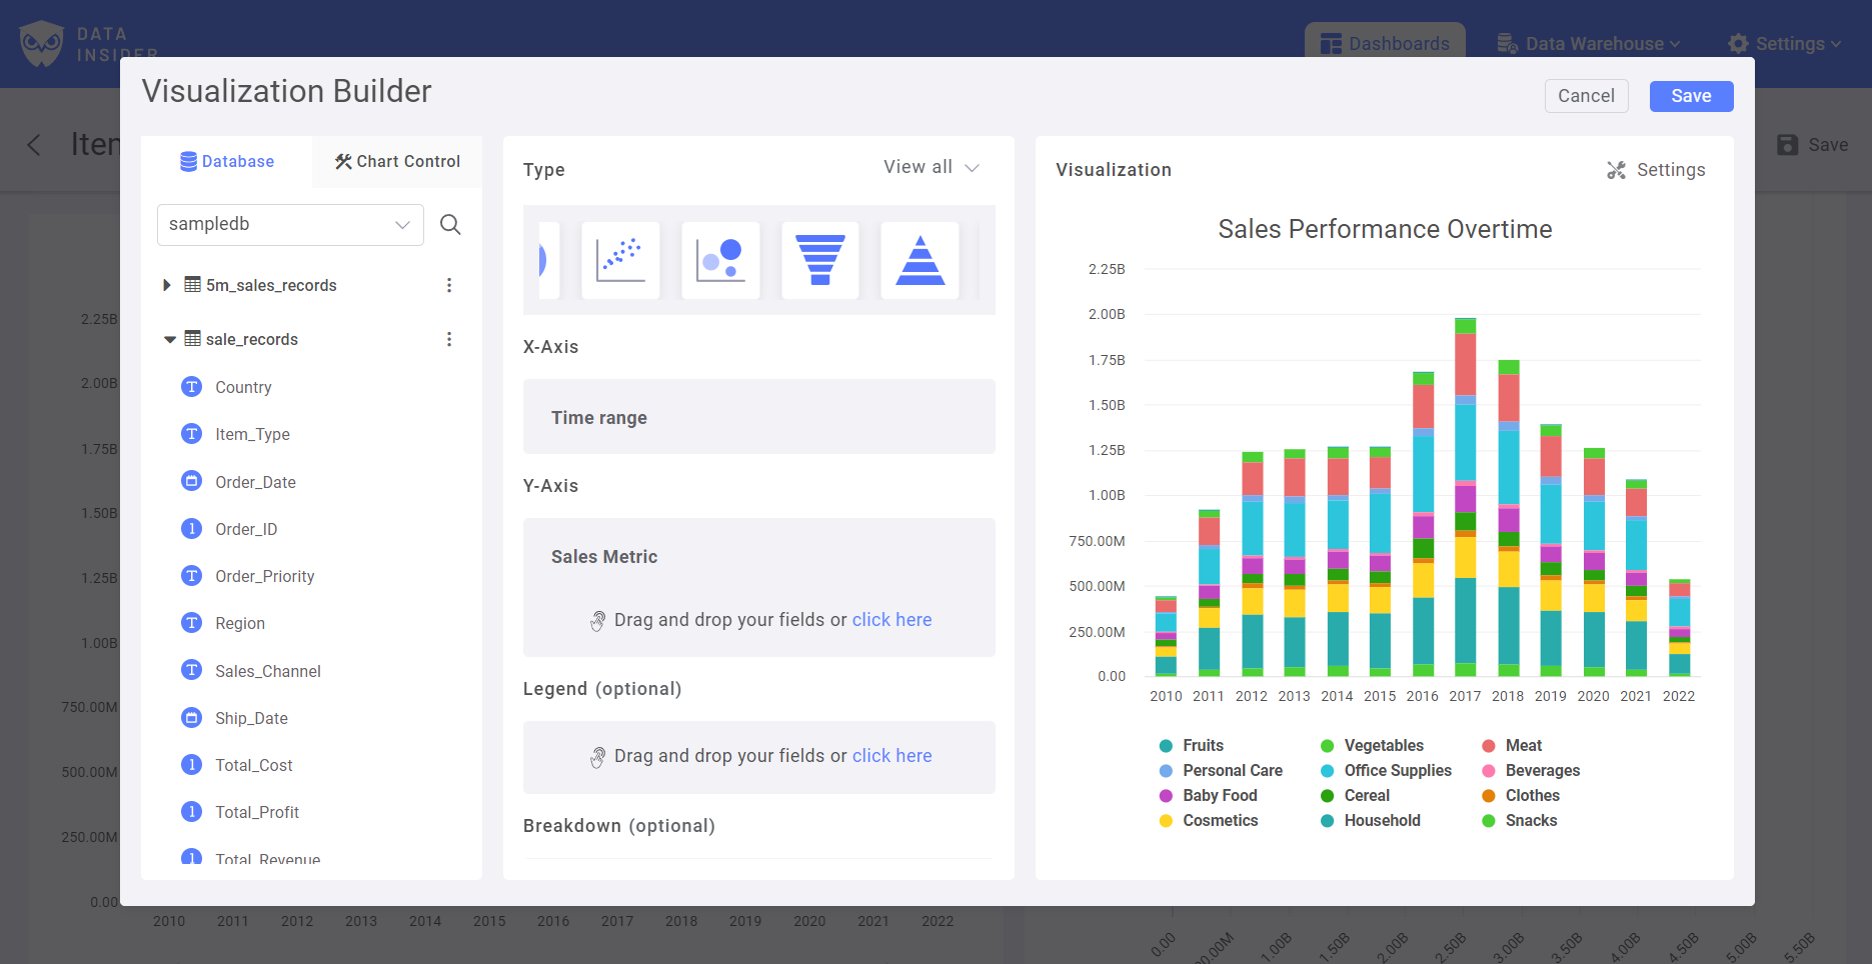
Drag-n-Drop Chart Builder: Users can efficiently perform drag-and-drop actions to create charts and fully customisable informative reports with a wide range of easy-to-use and flexible settings options.
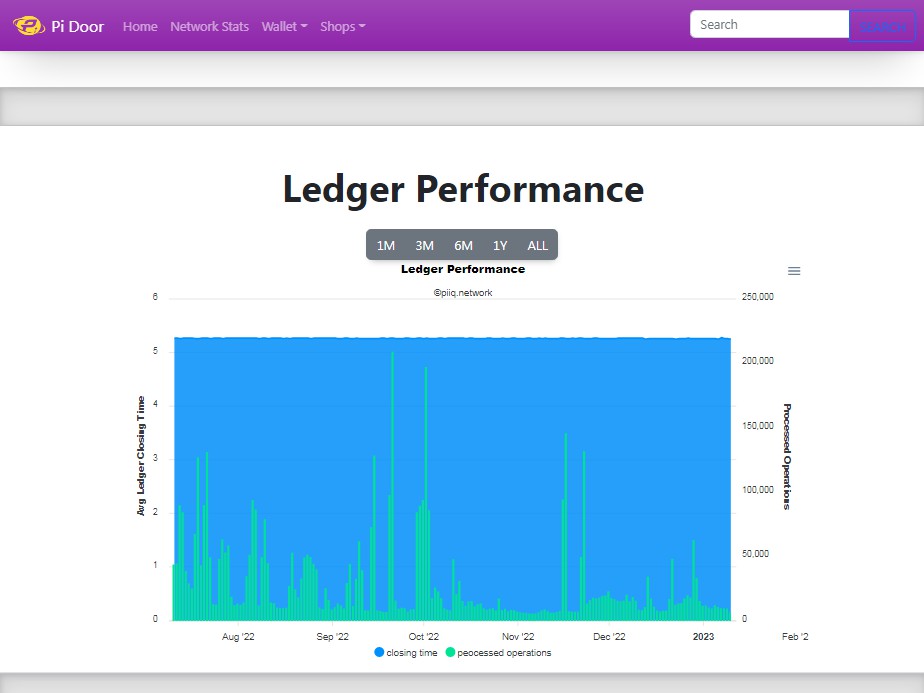
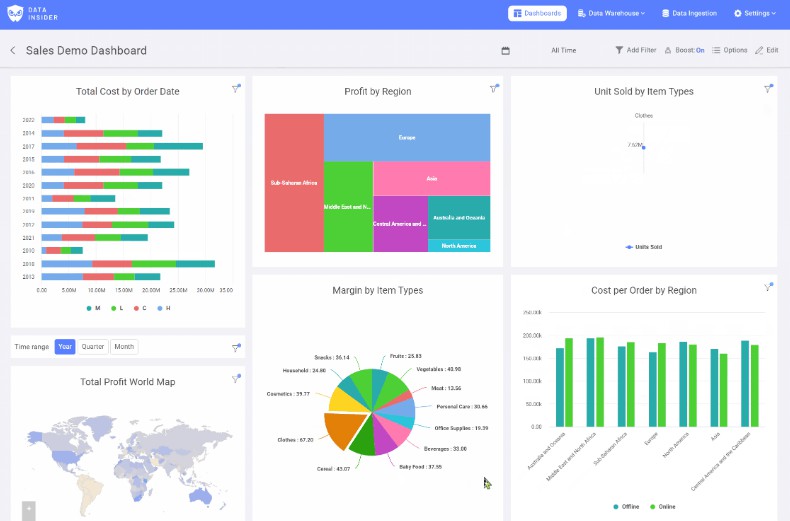
Interactive Dashboard: Help users visualise data, simply click to dig deeper into the underlying data and filter operational information so that data can be viewed from different perspectives or in more detail.

Apply filter to Dashboard: Using a dashboard filter, users can quickly apply different data viewpoints to a single dashboard rather than creating additional dashboards.

Add Control to Chart: Help users dynamically change the metrics to view multiple fields applied to that property with a simple click instead of creating multiple charts.

Drilldown your data: By clicking on a metric in a chart, users can quickly take a deep dive into a dataset to explore detailed information from various perspectives.

No Code ETL data: With our branded no-code data modeling, business users can load, transform & extract data without writing a single line of code.

Row-Level Security: Limit a user's access to certain data, define filters for each Attribute Value, and restrict data access to query and view at the row level.

Share & Collaboration: Share with the rest of your organisation by granting access or providing links to them.

Calculated & Measurement Fields: Create a dynamic data view by using existing database fields and applying additional logic.

Create Relationship: Click and connect relationships from multiple tables, and do cross sources analysis.

Schema Management with Data Encryption: Collect, store, and utilise data in a cost-effective, efficient, and secure manner