vue-declarative-plots
This repository will serve as a place for reusable Vue plot components (built with D3). These components were developed for use in iMuSE.
Installation
Coming soon
Development
Install dependencies:
yarn
Serve for development at http://localhost:8080:
yarn run serve
Build for production (generates /dist and /examples):
yarn run build
Run tests with jest:
yarn run test
Compile documentation with documentationjs:
yarn run docs
Plot Components
- BarPlot :white_check_mark:
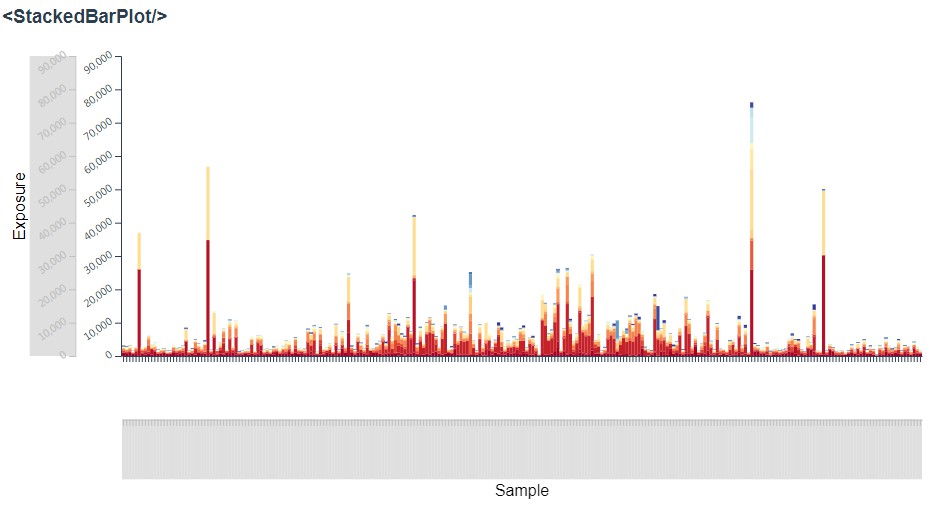
- StackedBarPlot :white_check_mark:
- ScatterPlot :white_check_mark:
- GenomeScatterPlot :white_check_mark:
- GenomeStackedBarPlot
- GenomeTrackPlot
- TrackPlot :white_check_mark:
- MultiTrackPlot
- BoxPlot :white_check_mark:
- MultiBoxPlot :white_check_mark:
- ViolinPlot
Axis Components
- Axis :white_check_mark:
- GenomeAxis :white_check_mark:
- DendrogramAxis
Other Components
- PlotContainer :white_check_mark:
- Legend
- SortOptions :white_check_mark:
Goals:
- [x] props should declare visual encodings of data
- example: the StackedBarPlot component will accept the following props:
x="sample_id"
y="exposure"
c="signature" // color
- example: the StackedBarPlot component will accept the following props:
- [x] props should declare where to find the data
- data will never be passed directly to a plot - instead it will be globally accessible by a key
- for now, assume data is stored in a global JSON object with
<key>: <data>mappings - example: for a dataset with key
exposures_data, the following prop would specify to a plot component that this dataset should be used:data="exposures_data"
- [x] props should declare where to find the scales
- [x] scales will be ES6 classes with different APIs depending on whether categorical, continuous, etc...
- [x] scales will always expose a domain
- [x] scales will always expose a domain-var-to-color function
- [ ] the color scale (or even individual colors) should also be able to be changed programmatically
- [x] scales will always expose a domain-var-to-human-readable-text function
- [x] categorical scales will always expose a sort function that takes in a specification of the data that will define the ordering
- [x] scales will always expose a filter function (and a corresponding filter-reset function)
- if categorical, this will accept an array of new values
- if continuous, this will accept a
[min, max]array - if binary, this will accept a boolean value
- scales should contain all of the information necessary to draw a legend
- scales will never be passed directly to a plot - instead they will be globally accessible by a key
- for now, assume scales are stored in a global JSON object with
<variable>: <scale>mappings - example: for a variable
sample_id, the following prop would specify to a plot component that this scale object should be used for the x axis:x="sample_id"
- [x] plots should assume which type of scale is on which axis
- for example, a bar plot (with vertical bars) would assume a continuous y scale and a categorical x
- [x] events should alert plots when a scale has been mutated
- these alerts should specify which scale has been updated using a key
- plot components should listen for these updates and re-draw if necessary
- scales may be mutated upon filter or zoom
- [x] data should be immutable
- even small variations of data sets should be stored in a separate
DataContainerinstance - however, plots may need to subscribe to data updates for asynchronous loading reasons
- even small variations of data sets should be stored in a separate
- [x] plots should NOT draw their own axes
- axes should be independent of plots
- axes should be contained in their own components
- [x] axes should accept props specifying which scale to use, and where to draw
- example:
variable="sample_id"
side="bottom"
- example:
- [x] axes should be brush-able
- [x] plots and axes should accept
widthandheightprops- container components should be responsible for keeping plot and axis props in sync if they are dynamic
- example:
:pWidth="windowWidth"
:pHeight="300"
- [x] plots should accept margin props
- container components should be responsible for keeping margin props in sync if they are dynamic
- example:
:pMarginTop="10"
:pMarginLeft="50"
:pMarginRight="20"
:pMarginBottom="0"
- [x] plots should emit click events, specifying variables in a predefined order to a prop-supplied callback
- example:
:clickHandler="chooseSample" // will be called with chooseSample(x, y, c) - [x] plots should have tooltips
- tooltips should obtain human-readable variable names from the appropriate scale
- [x] plots should dispatch applicable hover events
- dispatching should be done through the scale
- example:
- hovering on a section of a bar on a stacked bar plot would cause dispatches for (at least) the
xandcolorvariables
- hovering on a section of a bar on a stacked bar plot would cause dispatches for (at least) the
- [x] the internals of the drawing of the plots should be abstracted away as much as possible
- details of SVG, canvas, etc. implementation should be contained
- [x] all meaningful interactions will be stored in a history stack
- meaningful interactions: scale filter/zoom/sort
- will allow backward(undo)/forward(redo) operations
- will allow "replaying" of the user's interactions
- will allow sharing of a user session, so that others may replay or step through the interactions
- but this should also be optional, for example if the user chooses not to supply the stack to a plot via prop