vueOrgChart
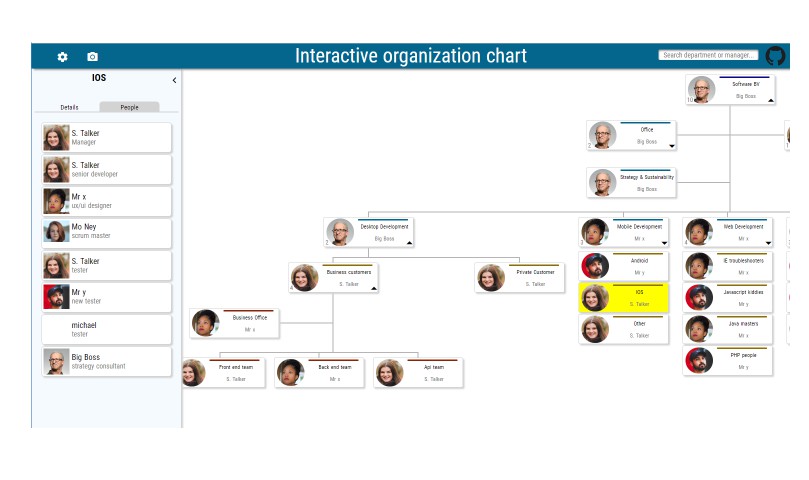
Organization chart Static website (no webserver required) to generate an interactive organisation chart (c) Michael Hoogkamer.
Manage and publish your interactive organization chart (orgchart), free and no webserver required.
Use as static website
You can use it as-is as a static website: no install, no webserver needed!
- Copy content of \docs folder to any location, like a folder on your computer, AWS S3 bucket or webserver
- Open index.html in the browser. When you use Internet Explorer it will not work if you placed the files on a folder (Chrome does work). S3 or webserverer will work for both browsers
Configure
var CONFIG = {
  title: {
    color: '#05668d',
    text: 'Interactive organization chart'
  },
  photoUrl: {
    prefix: 'photos/',
    suffix: '.png'
  },
  linkUrl: {
    prefix: 'photos/',
    suffix: '.png'
  },
  startView: {
    photos: true,
    names: true,
    columnview: true,
    staffColumnview: false
  },
  enableScreenCapture: true,
  levelColors: ['#0c058d', '#05668d', '#8d6e05', '#8d2305', '#cfb303']
}
The config file is in /config.js or if you want to build yourself in /static/config.js
-
You can set the header color and title, and the colors of each level in the orgchart
-
The position where to get the photo's
For these locations it is fetched from "prefix" + photo + "suffix". So if you have photo P0001, it will be fetched from "photos/P0001.png". If you have an api or other locations which delivers photo's based on the photo field you can change that here. -
The linkUrl
It will open a new tab to navigate to that page when clicked in the sidescreen on a person. In this example it will just fetch the photo in a new tab, but if you have an api which shows a user profile page you can enter the location here.
startView sets the inital options (the user can change them in the menu bar) -
Enable screen capture
This shows the icon to make an image of the graph to save. This does not work when you are on a local folder, so disable this option then
User manual for website
- Options > Column view:
Shows underlying departments in a column, giving a compact overview. You can also prevent this for staff departments - Options > Show manager photo/Show manager name
Show/hide the photos and/or names in the graph
FAQ
-
How can I change/edit the graph?
Type _edit in the searchbar to swith to editmode. Now you can edit the graph in the application or update via excel -
How does editing work in the application?
- Left-click on a department and edit the name, description of type staff in the left screen. To change the manager, press the pencil and search for the right person. You can also add a new person, by filling in a name and id. First unselect the current manager then, if the department already has a manager
- Add people the same way (use the people tab in the left screen). You can also provide the role the person has in the department
- Right-click on a department in the chart to add a department below
- With right-click you can also move a department: select Cut, then click on another department and right-click and select paste. Do not paste a parent under one of its children (this check has to be build)
-
How does editing work in excel?
Select File > Export excel. It contains:- chart: id, name, description, parent, indicator for staff department, and id of the manager (from the people tab)
- people: id, name, link to photo (see also config.js above), and main role/function of the person
- assignment: department id (from chart tab), person id (from people tabl) and role. These are the people working for the department. (manager is assigned in the chart tab) People can be assigned to multiple departments, or even more times to 1 department (with different role for example)
When done, select File > Import excel
-
How do I save the changes for others to see?
Everything happens at client side, so changes are only available for you. And if you refresh the page the changes will be gone. To make the changes persistent you must select File > Generate inputfile to create a javascript file which contains the data. This file (data.js) you then must place in the root folder this application is at, replacing the already existing file data.js -
Who can edit the graph?
Anyone can edit, but as stated above, it will be only available for that person. To make the data available for others, you need write access to the folder this application is at, so you can overwrite the data.js file -
How do I change the order of the departments under a parent?
This is not directly supported. There are 2 possibilities however. First switch to editmode. 1) export to excel, then change the order in the sheet, and then read the excel in again 2) cut the department, and paste it under the same parent again. It will be placed last. -
Why does running from a local folder not work in Internet Exporer?
I do not know, it has something to do with routing. I could use some help with that :) It does work in Chrome however, and running from a webserver or S3 bucket works for both browsers
Build Setup
# install dependencies
$ npm install

# serve with hot reload at localhost:3000
$ npm run dev

# build for production and launch server
$ npm run build
$ npm start

# generate static project
$ npm run generate
static output will be place in \dist folder, copy this to any location