Video
Business_metrics.mp4
Charts
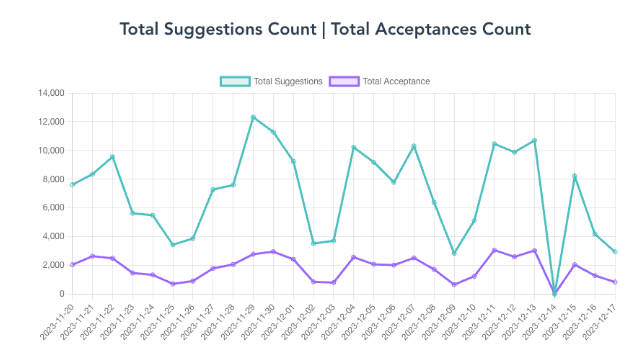
This application includes a set of charts to visualize various metrics related to GitHub Copilot for your GitHub Organization. These visualizations are designed to provide clear representations of the data, making it easy to understand and analyze the impact and adoption of GitHub Copilot.
Key Metrics
Here are the key metrics visualized in these charts:
- Acceptance Rate: This metric represents the ratio of accepted lines to the total lines suggested by GitHub Copilot. This rate is an indicator of the relevance and usefulness of Copilot's suggestions.
-
Total Suggestions This chart illustrates the total number of code suggestions made by GitHub Copilot. It offers a view of the tool's activity and its engagement with users over time.
-
Total Acceptances: This visualization focuses on the total number of suggestions accepted by users.
-
Total Lines Suggested: Showcases the total number of lines of code suggested by GitHub Copilot. This gives an idea of the volume of code generation and assistance provided.
-
Total Lines Accepted: As the name says, the total lines of code accepted by users (full acceptances) offering insights into how much of the suggested code is actually being utilized incorporated to the codebase.
- Total Active Users: Represents the number of active users engaging with GitHub Copilot. This helps in understanding the user base growth and adoption rate.
Requirements
Your organization must be enrolled in the GitHub Copilot API private alpha.
Setup instructions
- Instrucions on how to authenticate are provided in the API documentation - available if you have access to the private alpha.
- Edit the .env file in the root directory of the project and add the following variables:
  VUE_APP_GITHUB_ORG=
  VUE_APP_GITHUB_TOKEN=
Running
npm install
Compiles and hot-reloads for development
npm run serve
Compiles and minifies for production
npm run build
Lints and fixes files
npm run lint
Coming next ?
- Enterprise level charts
- Language breakdown analysis


