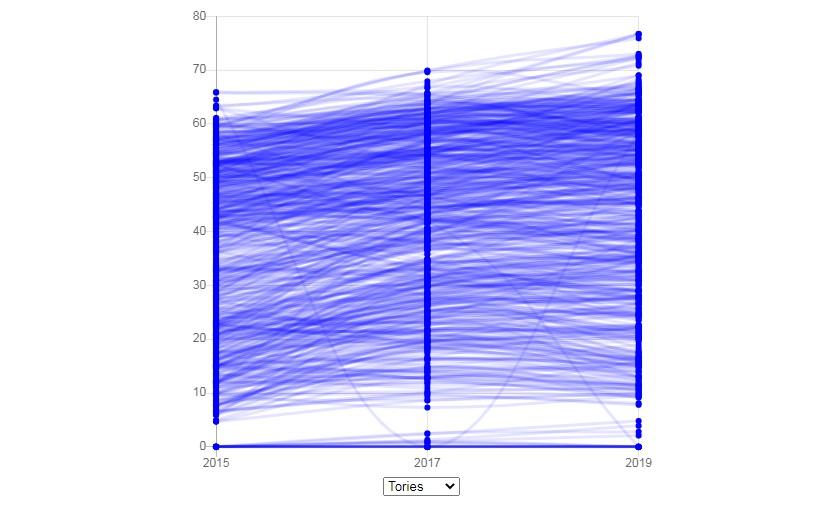
UK General Election Data Visualiser
DEMO
Visit https://b-xb.github.io/ge-data/ to see a working demo.
About
This is a small demo application using Vue.js and Chart.js to make graphs of UK election data.
It is very simple at the moment but I may well add in more features in the future.
Possible Future Features
-
More Filters
- Filter by region
- Filter by EU referendum data
- More political parties
- Filter by seats gained/lost
-
Select Multiple
- Show data for different political parties on the same graph
-
Averages
- Calculate average lines for certain sets of data
-
Comparisons
- Compare selected graph data side by side or combined into the same graph
-
More data
- Include more data from previous years
Project setup
npm install
Compiles and hot-reloads for development
npm run serve
Compiles and minifies for production
npm run build
Lints and fixes files
npm run lint
Deploy to Github Pages
npm run build
npm run deploy