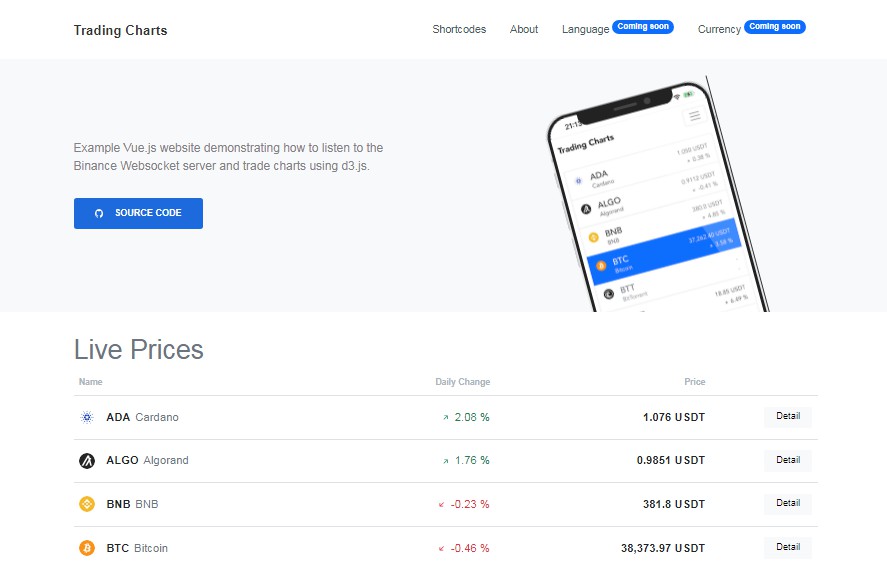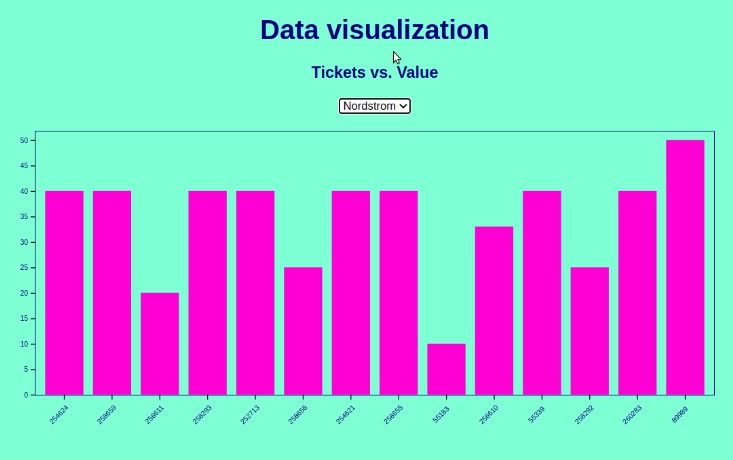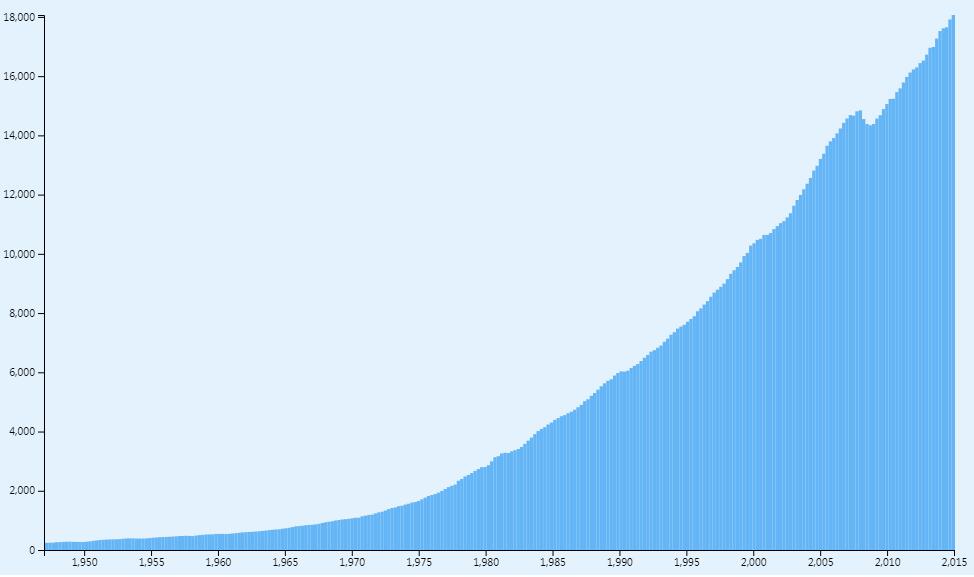
d3.js Bar Chart
Visualize Data with a d3.js Bar Chart.
Made with
Html
Css/SCSS
Javascript
Html
<v-app id="app">
  <v-container fluid fill-height>
    <v-layout align-center wrap>
      <v-flex xs12 class="mb-5">
        <d3-bar-chart
                      :app-name="appName"
                      :d3-data="d3Data"
                      ></d3-bar-chart>
      </v-flex>

    </v-layout>
  </v-container>
</v-app>
Css
/* Hide side scrollbar if content does not need it */
html {
  overflow-y: auto;
}

.application {
  font-family: 'Raleway', sans-serif;
  line-height: 2rem;
  text-align: center;
}

/* Full screen background */
#app {
  /* Location of the image */
  background-image: url(https://raw.githubusercontent.com/ijklim/gdp/gh-pages/assets/img/bg.jpg);

  /* Background image is centered vertically and horizontally at all times */
  background-position: top left;

  /* Background image doesn't tile */
  background-repeat: repeat;
}

.tooltip {
  font-family: 'Raleway';
  font-size: 1.5em;
  position: absolute;
  top: 0px;
  left: 0px;
  padding: 10px 20px;
  border-radius: 5px;
  background: #0D47A1;
  color: white;
}
Javascript
const WRAPPER = {
  width: 1100,
  height: 700,
  padding: 60,
  background: '#fff'
}

const CANVAS = {
  margin: {
    top: 20,
    right: 20,
    bottom: 25,
    left: 50
  }
}

const CHART = {
  width: WRAPPER.width - WRAPPER.padding * 2 - CANVAS.margin.right - CANVAS.margin.left,
  height: WRAPPER.height - WRAPPER.padding * 2 - CANVAS.margin.top - CANVAS.margin.bottom,
  background: '#E3F2FD',
  barColor: '#64B5F6',
  barOffset: 0
}

Vue.component('d3-bar-chart', {
  template: `
<div
class="elevation-5 pt-4"
:style="wrapperStyles"
>
<h2 class="mb-4 display-1">{{ appName }}</h2>
<div :id="id" />
</div>
`,
  // svg cannot be property by itself, changes object type during assignment, within ddd object is fine
  data () {
    return {
      axis: {
        x: {},
        y: {}
      },
      ddd: {},
      id: 'd3-' + Math.round(Math.random() * 1000000)
    }
  },
  props: {
    appName: {
      type: String,
      default: ''
    },
    d3Data: {
      type: Object,
      default: () => {}
    }
  },
  computed: {
    wrapperStyles () {
      return `height:${WRAPPER.height}px; width:${WRAPPER.width}px; margin:auto; background:${WRAPPER.background};`;
    }
  },
  watch: {
    /**
     * Data is now available to build structure of chart, e.g. xGuide, yGuide
     */
    d3Data () {
      // X axis
      this.axis.x.values = d3.scaleLinear()
        .domain([d3.min(this.d3Data.x), d3.max(this.d3Data.x)])
        .range([0, CHART.width]);
      // How far apart are the ticks on x axis, e.g. 7 days apart
      this.axis.x.ticks = d3.axisBottom(this.axis.x.values)
        .ticks(10);
      // Setting first, last and gap between bars, note d3DataY is required
      this.axis.x.scale = d3.scaleBand()
        .domain(this.d3Data.y)
        .paddingInner(CHART.barOffset)
        .paddingOuter(0)
        .range([0, CHART.width]);
      // transform(x, y) specifies where x axis begins, drawn from left to right
      let xGuide = this.ddd.svg.append('g')
      .attr('transform', `translate(${CANVAS.margin.left}, ${CANVAS.margin.top + CHART.height})`)
      .call(this.axis.x.ticks);


      // Y axis
      // .range specifies value from top left (high number) to bottom left (0)
      this.axis.y.values = d3.scaleLinear()
        .domain([0, d3.max(this.d3Data.y)])
        .range([CHART.height, 0]);
      // How many ticks are on the y axis
      this.axis.y.ticks = d3.axisLeft(this.axis.y.values)
        .ticks(10);
      this.axis.y.scale = d3.scaleLinear()
        .domain([0, d3.max(this.d3Data.y)])
        .range([0, CHART.height]);
      // translate(x, y) specifies where y axis begins, drawn from top to bottom
      let yGuide = this.ddd.svg.append('g')
      .attr('transform', `translate(${CANVAS.margin.left}, ${CANVAS.margin.top})`)
      .call(this.axis.y.ticks);

      this.draw();
      this.addListeners();
    }
  },
  methods: {
    /**
     * Draw bars on chart
     */
    draw () {
      // translate(x, y) specifies where bar begins, +1 to move right of y axis
      this.ddd.chart = this.ddd.svg.append('g')
        .attr('transform', `translate(${CANVAS.margin.left + 1}, 0)`)
        .selectAll('rect')
        .data(this.d3Data.y)
        .enter()
        .append('rect');

      this.ddd.chart
        .attr('fill', (data, index) => {
        return CHART.barColor
      })
      // .width sets width of bar
        .attr('width', _ => this.axis.x.scale.bandwidth())
        .attr('x', (data, index) => this.axis.x.scale(data))
        .attr('y', CHART.height + CANVAS.margin.top);

      // .delay sets speed of drawing
      this.ddd.chart
        .transition()
        .delay((data, index) => index * 5)
        .duration(100)
        .ease(d3.easeCircleIn)
        .attr('y', data => CHART.height - this.axis.y.scale(data) + CANVAS.margin.top)
        .attr('height', data => this.axis.y.scale(data));
    },
    addListeners () {
      let component = this;
      this.ddd.chart
        .on('mouseover', function(yData, index) {
        let tooltipX = d3.event.pageX + 5;
        let tooltipY = d3.event.pageY - 100;
        component.ddd.tooltip.html(component.d3Data.tooltip[index])
          .style('left', `${tooltipX}px`)
          .style('top', `${tooltipY}px`)
          .style('opacity', 1);

        d3.select(this)
          .style('opacity', .5)
      })
        .on('mouseout', function(data) {
        component.ddd.tooltip.html('')
          .style('opacity', 0);

        d3.select(this)
          .transition()
          .duration(300)
          .style('opacity', 1)
      });
    }
  },
  mounted () {
    // Step #1: Select div to place d3 chart, set dimensions and color
    // Note: Code below must be in mounted(), created() does not work
    d3.select(`#${this.id}`)
      .append('svg')
      .attr('width', CHART.width + CANVAS.margin.right + CANVAS.margin.left)
      .attr('height', CHART.height + CANVAS.margin.top + CANVAS.margin.bottom)
      .style('background', CHART.background);
    this.ddd.svg = d3.select(`#${this.id} svg`);
    this.ddd.tooltip = d3.select('body')
      .append('div')
      .attr('class', 'tooltip elevation-3')
      .style('opacity', 0);
  }
});

let v = new Vue({
  el: '#app',
  data () {
    return {
      appName: 'US Gross Domestic Product',
      d3Data: {}
    }
  },
  methods: {
    formatTooltipData (date, value) {
      return `
<div>$${value.toLocaleString('en-US')} Billion</div>
<div>${date.substr(0, 4)} - ${(new Date(date)).toLocaleString('en-US', { month: 'long' })}</div>
`;
    }
  },
  mounted () {
    let url = 'https://raw.githubusercontent.com/FreeCodeCamp/ProjectReferenceData/master/GDP-data.json';
    fetch(url)
      .then(response => response.json())
      .then(json => {
      let d3DataX = [];
      let d3DataY = [];
      let d3Tooltip = [];
      json.data.forEach(([date, value]) => {
        d3DataX.push(+date.substr(0, 4));
        d3DataY.push(value);
        d3Tooltip.push(this.formatTooltipData(date, value));
      });
      this.d3Data = {
        x: d3DataX,
        y: d3DataY,
        tooltip: d3Tooltip
      };
    })
      .catch(error => {
      console.error("Error encountered", error);
    });
  }
});
Author
Ivan Lim
Demo
See the Pen Visualize Data with a d3.js Bar Chart by Ivan Lim (@ivanlim) on CodePen.