VueFunnelGraph.js
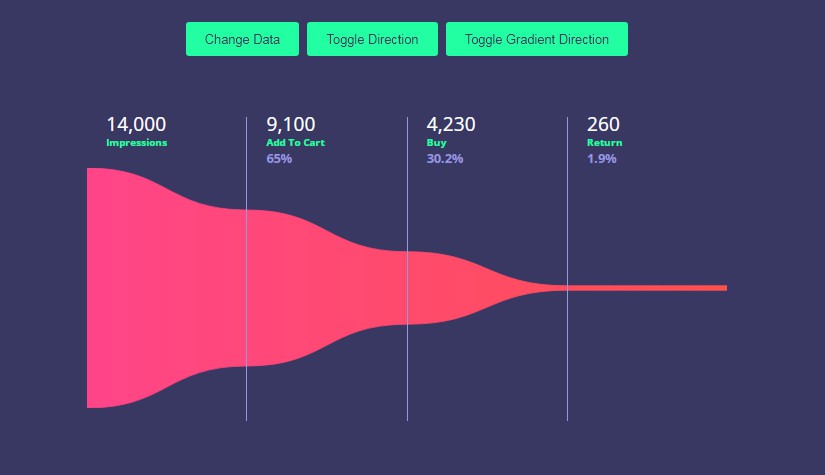
Funnel graph drawing library for Vue.js.
- SVG charts
- Values, Labels, Percentages display
- Two-dimensional graph support
- Legend display
- Detailed percentage breakdown on hover
- Animated
- Solid color and gradient fill
- Horizontal and vertical charts

This is the Vue.js version of FunnelGraph.js, learn more about the library and see documentation here.
Development Demo
- Clone the repo
- Navigate to
srcfolder - Run
vue serve example.vue - Visit the URL displayed
Installation
NPM
npm i vue-funnel-graph-js
UNPKG
<script src="https://unpkg.com/vue-funnel-graph-js"></script>
CDN
<script src="https://cdn.jsdelivr.net/npm/vue-funnel-graph-js/dist/vue-funnel-graph.min.js"></script>
Usage
After installing, import the VueFunnelGraph component:
import { VueFunnelGraph } from 'vue-funnel-graph-js';
You can now use the custom element:
<vue-funnel-graph :width="width" :height="height" :labels="labels"
              :values="values" :colors="colors" :sub-labels="subLabels" :direction="direction"
              :gradient-direction="gradientDirection"
              :animated="true" :display-percentage="true"
></vue-funnel-graph>
The values are passed to props:
export default {
name: 'app',
components: {
VueFunnelGraph
},
data() {
return {
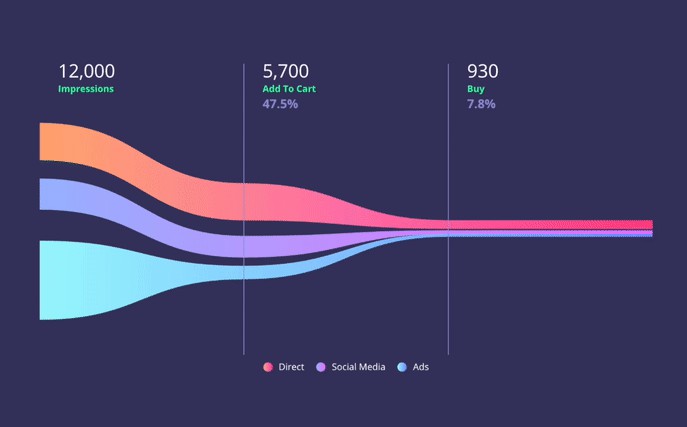
labels: ['Impressions', 'Add To Cart', 'Buy'],
subLabels: ['Direct', 'Social Media', 'Ads'],
values: [
// with the given Labels and SubLabels here's what the values represent:
//
// Direct, Social, Ads
// | | |
// v v v
[3000, 2500, 6500], // Segments of "Impressions" from top to bottom
[3000, 1700, 1000], // Segments of "Add To Cart"
[600, 200, 130] // Segments of "Buy"
],
colors: [
['#FFB178', '#FF3C8E'], // color set for "Impressions" segment
['#A0BBFF', '#EC77FF'], // color set for "Add To Cart" segment
['#A0F9FF', '#7795FF'] // color set for "Buy" segment
],
direction: 'horizontal',
gradientDirection: 'horizontal',
height: 300,
width: 800
};
}
}
Options
| Option | Description | Type | Required | Options | Default | Example |
|---|---|---|---|---|---|---|
width |
Width of the funnel graph | number |
Yes | 0 | 800 | |
height |
Height of the funnel graph | number |
Yes | 0 | 300 | |
labels |
Title of each data part | array |
Yes | ['Impressions', 'Add To Cart', 'Buy'] | ||
values |
Numbers that the funnel chart visualizes | array |
Yes | [12000, 4700, 930] | ||
colors |
Colors of the graph. If a string or array with one element passed it fills the graph with a solid color, if the array contains more than one element it fill the graph with a gradient. For two-dimensional charts and array of arrays shall be passed to fill each segment with a separate gradient. The array can contain arrays and strings mixed. If a there are more segments than colors provided, up to 10 extra segments will be filled with pre-defined solid colors | array⎮string |
Yes | [12000, 4700, 930] | ||
subLabels (:sub-labels) |
Title of each data segment | array |
Yes for two-dimensional graphs | ['Direct', 'Social Media', 'Ads'] | ||
direction |
Whether the chart visualization is displayed vertically or horizontally | string |
No | 'vertical', 'horizontal' | 'horizontal' | |
gradientDirection (:gradient-direction) |
Whether the gradient applied to the segments of the graph is displayed from top to bottom or from left to right | string |
No | 'vertical', 'horizontal' | 'horizontal' | |
animated |
Whether any change in graph shape will be displayed with a smooth transition | boolean |
No | true, false |
true |
false |
displayPercentage (:display-percentage) |
Whether to display the automatically calculated percentage values below the labels | boolean |
No | true, false |
true |