vue-apexcharts
Vue.js wrapper for ApexCharts to build interactive visualizations in vue.

Download and Installation
Installing via npm
npm install vue-apexcharts apexcharts
Usage
import VueApexCharts from 'vue-apexcharts'

Vue.use(VueApexCharts)
To create a basic bar chart with minimal configuration, write as follows:
<template>
   <div>
     <apexcharts width="500" type="bar" :options="chartOptions" :series="series"></apexcharts>
   </div>
</template>
import VueApexCharts from 'vue-apexcharts'

export default {
    components: {
      apexcharts: VueApexCharts,
    },
    data: function() {
      return {
        chartOptions: {
          chart: {
            id: 'vuechart-example'
          },
          xaxis: {
            categories: [1991, 1992, 1993, 1994, 1995, 1996, 1997, 1998]
          }
        },
        series: [{
          name: 'series-1',
          data: [30, 40, 45, 50, 49, 60, 70, 91]
        }]
      }
    },
};
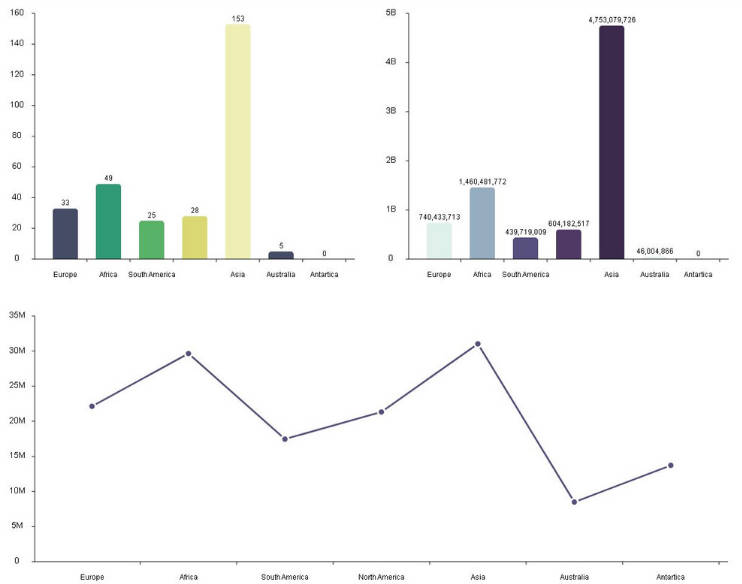
This will render the following chart

How do I update the chart?
Simple! Just change the series or any option and it will automatically re-render the chart. Have a look at the below example to see this in action
<template>
   <div class="app">
     <apexcharts width="550" type="bar" :options="chartOptions" :series="series"></apexcharts>
     <div>
       <button @click="updateChart">Update!</button>
    </div>
   </div>

</template>
export default {
    data: function() {
      return {
        chartOptions: {
          chart: {
            id: 'vuechart-example',
          },
          xaxis: {
            categories: [1991, 1992, 1993, 1994, 1995, 1996, 1997, 1998],
          },
        },
        series: [{
          name: 'series-1',
          data: [30, 40, 45, 50, 49, 60, 70, 81]
        }]
      }
    },
    methods: {
      updateChart() {
        const max = 90;
        const min = 20;
        const newData = this.series[0].data.map(() => {
          return Math.floor(Math.random() * (max - min + 1)) + min
        })

        const colors = ['#008FFB', '#00E396', '#FEB019', '#FF4560', '#775DD0']

        // Make sure to update the whole options config and not just a single property to allow the Vue watch catch the change.
        this.chartOptions = {
          colors: [colors[Math.floor(Math.random()*colors.length)]]
        };
        // In the same way, update the series option
        this.series = [{
          data: newData
        }]
      }
    }
};
Props
| Prop | Type | Description |
|---|---|---|
| series* | Array | The series is an array which accepts object in the following format. To know more about the format of dataSeries, checkout Series docs on the website. |
| type* | String | line, area, bar, pie, donut, scatter, bubble, heatmap, radialBar |
| width | Number/String | Possible values for width can be 100% or 400px or 400 |
| height | Number/String | Possible values for width can be 100% or 300px or 300 |
| options | Object | The configuration object, see options on API (Reference) |
How to call methods of ApexCharts programatically?
Sometimes, you may want to call other methods of the core ApexCharts library, and you can do so on this.$apexcharts global variable directly
Example
this.$apexcharts.exec('vuechart-example', 'updateSeries', [{
  data: [40, 55, 65, 11, 23, 44, 54, 33]
}])
In the above method, vuechart-example is the ID of chart, updateSeries is the name of the method you want to call and the third parameter is the new Series you want to update.
More info on the .exec() method can be found here
All other methods of ApexCharts can be called the same way.
What's included
The repository includes the following files and directories.
vue-apexcharts/
├── dist/
│   └── vue-apexcharts.js
└── src/
    ├── ApexCharts.component.js
    ├── Utils.js
    └── index.js
Running the examples
Basic Examples are included to show how to get started using ApexCharts with Vue easily.
To run the examples,
cd example
npm install
npm run serve
Development
Install dependencies
npm install
Bundling
npm run build