![]()
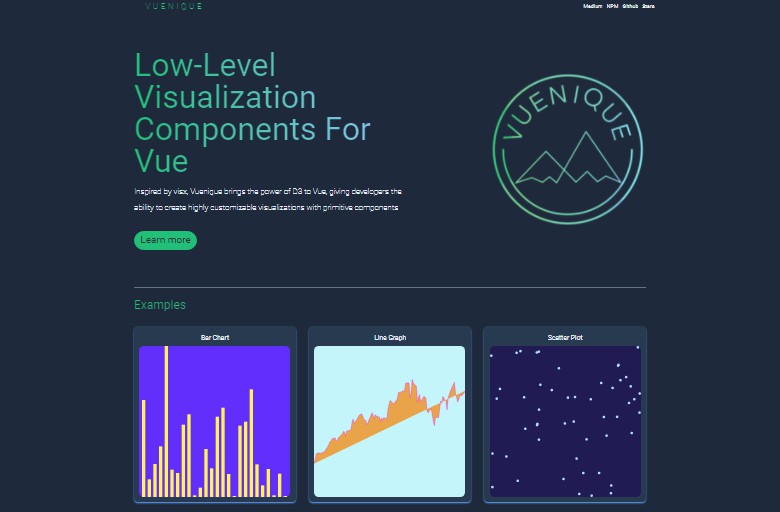
Vuenique
A low level visualization component library built for Vue
Introduction
Vuenique is a reusable low-level component visualization library that brings the power of D3 and visx to Vue
Installation
Install with npm:
npm install @vueniquejs/vuenique
Getting Started
- Import the components you need from the package.
import { Bar } from @vueniquejs/vuenique
- Pass in the necessary props.
<Bar x="5" y="5" />
- See your component render!
Check out our gallery for more examples of what you can build.
Documentation
Vuenique visualization components can be roughly grouped into several categories:
Shape
These are the building blocks of the framework. Map to shapes you can utilize within your visualizations.
<Bar />
Description: Staple of the bar chart, the component represents a single rectangular bar in your visualization.
Inputs: (Optional):
- className: class to be passed into components class
- any valid attributes (x, y, rx, ry, width, height, etc.) for SVG < rect> elements can be passed through props
Outputs: Returns a Vue component wrapped around a < rect> HTML element with any props passed in rendering as attributes on the element
<Circle />
Description: Staple of the scatter plot and other chart types utilizing circles, the component represents a single circle in your visualization
Inputs: (Optional):
- className: class to be passed into components class
- any valid attributes (cx, cy, r, etc.) for SVG < circle> elements can be passed through props
Outputs: Returns a Vue component wrapped around a < circle> HTML element with any props passed in rendering as attributes on the element
<LinePath />
Description: Staple of the line chart, the component represents a single line path in your visualization
Inputs: (Optional):
- className: class to be passed into components class
- any valid attributes for SVG < path> elements can be passed through props
Outputs: Returns a Vue component wrapped around a < path> HTML element with any props passed in
Group
Built around the < g> SVG element, Group acts as a wrapper around Shape components, allowing you to group pieces of a visualization together.
<Group />
Inputs: Props get passed to underlying < g> SVG element are rendered as HTML attributes on element. Components passed as children to Group get rendered within < g> container
Outputs: Container of Shape components passed a children in the form of < g> element
Scale
Scales package provides wrappers around D3.js library scale packages, which contains functions that help you to map your data into the graph’s pixels.
scaleBand()
Description: Provides a wrapper function around the D3 scaleBand() function, projecting discrete values into uniform bands of range.
Inputs:
- Config: scale object that optionally contains domain, range, round, reverse, align, padding properties.
Outputs: Returns an inner function that passes the invocation d3 scaleBand() function and the config object, which will create a new band scale and set the properties according to user input properties in the config object.
scaleLinear()
Description: Provides a wrapper function around the D3 scaleLinear() function, project continuous input values(domain) to out values(range)
Inputs:
- Config: scale object that optionally contains domain, range, reverse, clamp, interpolate, nice, round, zero, properties.
Outputs: Returns an inner function that passes the invocation d3 scaleLinear() function and the config object, which will create a new linear scale and set the properties according to user input properties in the config object.
scaleTime()
Description: Applies D3 scaleTime function to a configuration object to return a time scale.
Inputs:
- Config: user inputed scale object that accepts the domain, range, reverse, clamp, interpolate, nice, and round properties.
scaleUTC()
Description: Applies D3 scaleUtc function to a configuration object to return a time scale.
Inputs:
- Config: user inputed scale object that accepts the domain, range, reverse, clamp, interpolate, nice, and round properties.
scaleOrdinal()
Description: Provides a wrapper function around the D3 scaleOrdinal() function, project input values(domain) to out values(range)
Inputs:
- Config: scale object that optionally contains domain, range, reverse and unknown properties.
Outputs: Returns an inner function that passes the invocation d3 scaleOrdinal() function and the config object, which will create a new ordinal scale and set the properties according to user input properties in the config object.
scaleLog()
Description: Applies D3 scaleLog function to a configuration object to return a log scale.
Inputs:
- Config: user inputed scale object that accepts the domain, range, base, reverse, clamp, interpolate, nice, and round properties.
scaleQuantile()
Description: Applies D3 scaleQuantile function to a configuration object to return a quantile scale.
Inputs:
- Config: user inputed scale object that accepts the domain, range, and reverse properties.
scaleThreshold()
Description: Provides a wrapper function around the D3 scaleThreshold() function, allowing to map arbitrary subsets of the domain to discrete values to the range. Continuous domain values are divided into pieces based on a set of threshold values.
Inputs:
- Config: scale config object that optionally contains domain, range, and reverse properties.
Outputs: Returns an inner function that passes the invocation d3 scaleThreshold() function and the config object, which will create a new ordinal scale and set the properties according to user input properties in the config object.
Legend
Legends match the colors and shapes in your graph to your data, and are created using scales.
<LegendLinear />
Description: Renders a legend with values that increment in a linear fashion Inputs: (Required):
- scale: scale object generated from scale functions, used to create the legend items
(Optional):
- style: styles applied to the legend container
- domain: legend domain, a default is calculated if none is provided
- shapeWidth: width of the legend shape
- shapeHeight: height of the legend shape
- shapeMargin: margin of the legend shape
- labelAlign: flex-box alignment of legend item labels
- labelFlex: flex-box flex of legend item labels
- labelMargin: margin of legend item labels
- itemMargin: margin of legend items
- direction: flex direction of legend container
- itemDirection: flex direction of legend items
- fill: legend item fill accessor function
- size: legend item size accessor function
- shape: legend shape string preset
- shapeStyle: styles applied to legend shapes
- labelFormat: callback function that returns an item label from a provided label object
- labelTransform: given the legend scale and labelFormat, returns a callback function that generates a label object containing its datum, index, value, and label properties
- legendLabelProps: additional props that are passed down to LegendLabel component
- steps: number of legend items
Contributing
Contributions are what make the open source community such an amazing place to learn, inspire, and create. Any contributions you make are greatly appreciated. If you have a suggestion that would make this better, please fork the repo and create a pull request. You can also simply open an issue with the tag “enhancement”. Don’t forget to give the project a star! Thanks again!
- Fork the Project
- Create your Feature Branch (
git checkout -b feature/AmazingFeature) - Commit your Changes (
git commit -m 'Add some AmazingFeature') - Push to the Branch (
git push origin feature/AmazingFeature) - Open a Pull Request
License
Distributed under the MIT License.