JittorVis: Visual understanding of deep learning model

JittorVis is an open-source library for understanding the inner workings of Jittor models by visually illustrating their dataflow graphs.
Deep neural networks have achieved breakthrough performance in many tasks such as image recognition, detection, segmentation, generation, etc. However, the development of high-quality deep models typically relies on a substantial amount of trial and error, as there is still no clear understanding of when and why a deep model works. Also, the complexity of the deep neural network architecture brings difficulties to debugging and modifying the model. JittorVis facilitates the visualization of the dataflow graph of the deep neural network at different levels, which brings users a deeper understanding of the dataflow graph from the whole to the part to debug and modify the model more effectively.
JittorVis provides the visualization and tooling needed for machine learning experimentation:
- Displaying the hierarchical structure of the model dataflow graph
- Visualizing the dataflow graph at different levels (ops and layers)
- Profiling Jittor programs
Features to be supported in the future:
- Tracking and visualizing metrics such as loss and accuracy
- Viewing line charts of weights, biases, or other tensors as they change over time
- And much more
Related Links:
Installation
JittorVis need python version >= 3.7.
pip install jittorvis
or
pip3 install jittorvis
How to Develop
- run backend
cd backend
python server.py
- run frontend
cd frontend
yarn
yarn start
- generate doc
# frontend
cd frontend
yarn styleguide:build
# backend
cd ..
pdoc backend/ -o doc --html --force
Usage
There are several ways to use JittorVis.
- Visualizing a Jittor model directly.
import jittor as jt
from jittor import Module
from jittor import nn
import numpy as np

class Model(Module):
    def __init__(self):
        self.layer1 = nn.Linear(1, 10)
        self.relu = nn.Relu()
        self.layer2 = nn.Linear(10, 1)
    def execute (self,x) :
        x = self.layer1(x)
        x = self.relu(x)
        x = self.layer2(x)
        return x

model = Model()

from jittorvis import server
input = jt.float32(np.random.rand(10, 1))
server.visualize(input, model, host = '0.0.0.0')
# JittorVis start.
# server.stop()
# JittorVis stop.
Then open the link ‘http://localhost:5005/static/index.html‘ in your browser.
- Visualizing an exported Jittor computational graph (an example graph can be downloaded here).
from jittorvis import server
server.run('test.pkl', host='0.0.0.0', port=5005)
# JittorVis start.
# server.stop()
# JittorVis stop.
- Visualizing an exported Jittor computational graph with command line interface.
jittorvis --data_path test.pkl --host='0.0.0.0' --port=5005
Visualization
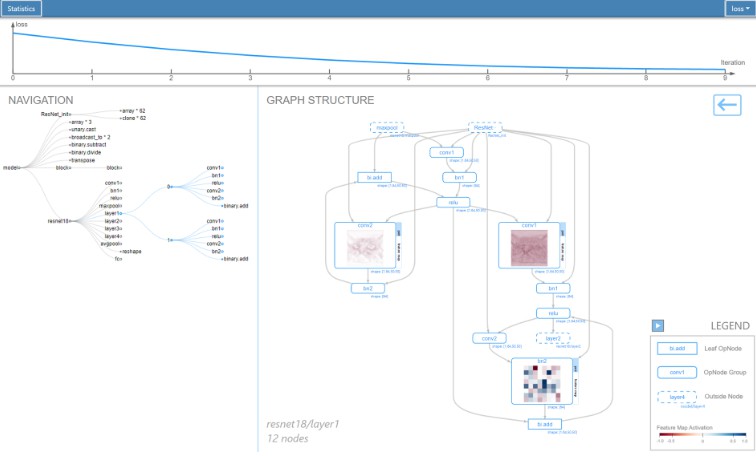
JittorVis contains three main views: statistics view, navigation view, and graph structure view.
-
Statistics view:
The statistics view provides statistics information for the deep neural network, such as loss and accuracy.
-
Navigation view:
The navigation view visualizes the hierarchical structure of a Jittor model to facilitate the exploration of the model. Each tree node represents a computational node in the dataflow graph, and each leaf node represents a basic operation in the graph. Users can click one intermediate node to selected its computational nodes and turn to the graph structure view to explore their graph structure.

-
Graph structure view:
The graph structure view displays the graph structure of a Jittor graph. In the graph structure view, each rectangle represents a computational node, and each link represents dataflows among computational nodes. The graph structure view has the following interactions:
- Drag to pan
- Scroll to zoom in and out
- Click one computational node to explore its feature map
- Click the top-right plus button of one computational node to explore its children
- Click the top-right button “←” to return to the previous level of the graph
- Right-click one computational node to explore its detailed information

Citation
Towards Better Analysis of Deep Convolutional Neural Networks
@article {
    liu2017convolutional,
    author={Liu, Mengchen and Shi, Jiaxin and Li, Zhen and Li, Chongxuan and Zhu, Jun and Liu, Shixia},
    journal={IEEE Transactions on Visualization and Computer Graphics},
    title={Towards Better Analysis of Deep Convolutional Neural Networks},
    year={2017},
    volume={23},
    number={1},
    pages={91-100}
}
Analyzing the Training Processes of Deep Generative Models
@article {
    liu2018generative,
    author={Liu, Mengchen and Shi, Jiaxin and Cao, Kelei and Zhu, Jun and Liu, Shixia},
    journal={IEEE Transactions on Visualization and Computer Graphics},
    title={Analyzing the Training Processes of Deep Generative Models},
    year={2018},
    volume={24},
    number={1},
    pages={77-87}
}
Analyzing the Noise Robustness of Deep Neural Networks
@article {
    cao2021robustness,
    author={Cao, Kelei and Liu, Mengchen and Su, Hang and Wu, Jing and Zhu, Jun and Liu, Shixia},
    journal={IEEE Transactions on Visualization and Computer Graphics},
    title={Analyzing the Noise Robustness of Deep Neural Networks},
    year={2021},
    volume={27},
    number={7},
    pages={3289-3304}
}
The Team
JittorVis is currently maintained by the THUVIS Group. If you are also interested in JittorVis and want to improve it, Please join us!
License
JittorVis is Apache 2.0 licensed, as found in the LICENSE.txt file.