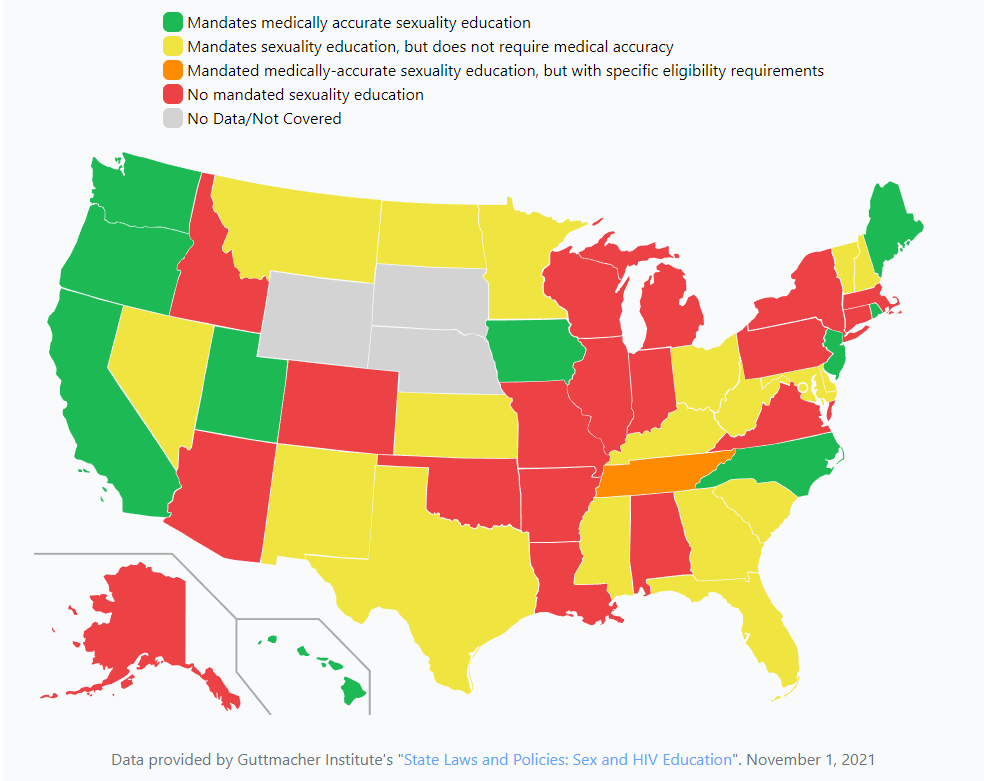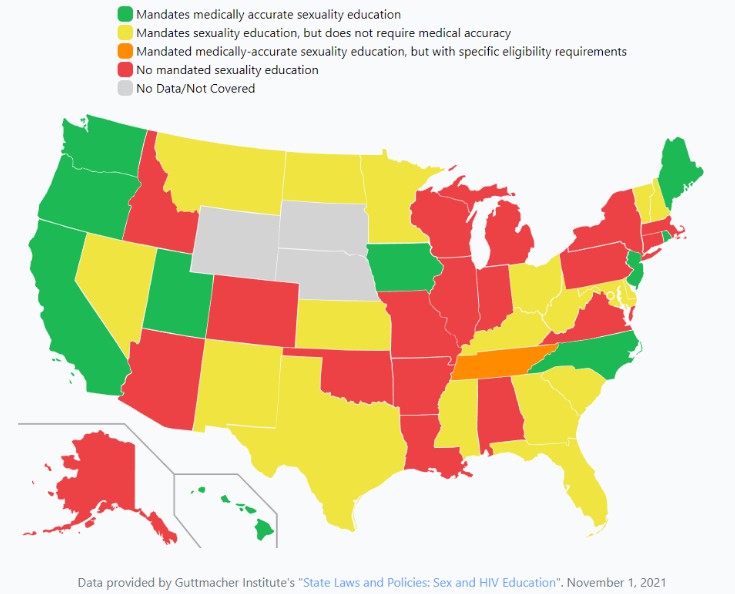
Mapped – United States
Note: This project was built as a final project for a sexuality education class covering topics of gender, orientation, consent, and other topics not often found in these types of classes. The goal of this project was to promote better education on these topics for all by putting this data in an easily understandable format.
Project Description
When taking this class, I really found the data about education on these topics across the country surprising. I learned of how little states require this education, even less medically accurate education, and that struck me. Religion, personal beliefs, and not taking care to understand “why” were getting in the way of creating safe and positive lives for many people. It struck me further when I learned that some things taught in my elementary and middle schools were borderline incorrect, or taught in a weird way, and were very heteronormative. And in addition, a friend of mine across the country getting some of this false, “abstinence is the only way” education from a really old textbook even today surprised me. But something super important that didn’t hit me at first was the big picture: the data on what was going on in each state, and how it differed from my experience. I wanted to build something that could help me, and many other people, see and understand this.
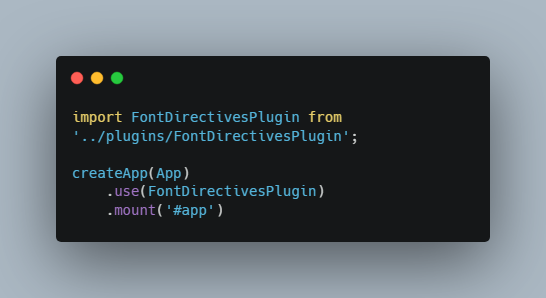
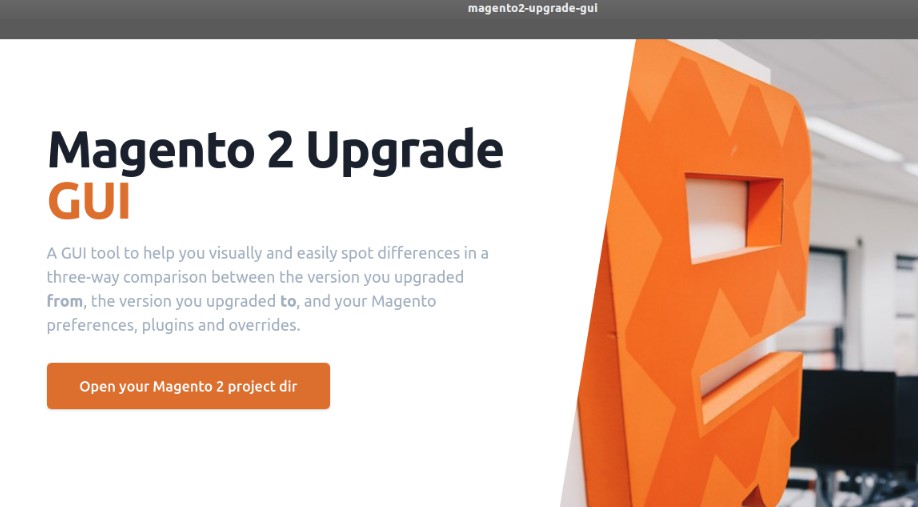
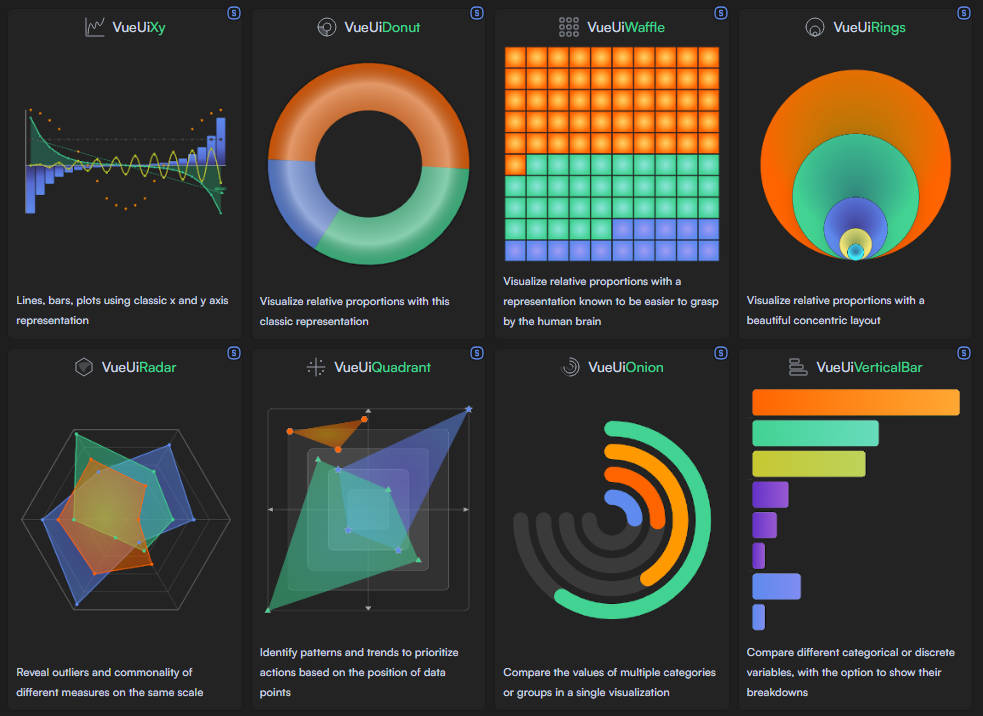
I chose a website as my format, as millions of students and even more people across the country have internet access. It’s a format which can be easily accessible and utilized in research projects, classrooms, or just for fun. I really enjoyed the process of this project. Not only did I learn a lot about information on my selected topics, but I improved my skills in developing websites. I also designed this project in a very flexible way, allowing me to edit or add new datasets through simply formatted files. If I wanted to improve on this project in the future, or add more topics, that would be easy to do. I hope that my audience and future sophomores enjoy the data displayed this way as much as I did, and that someone uses or expands on it to make a well-needed change in any, or all of my covered topics. In the end, I’m very happy with how it turned out, but I feel like there’s always more data I could be displaying!
While any final project I make isn’t likely to provide as great of an education as this class, easily accessible and well-displayed data can help people see and understand what’s really happening in our country. It can be used to educate students to become future changemakers through seeing these problems, and promote change through factual information. My goal is for this project to do that. To be used in ways that make the future safe and positive for everyone.
Project Screenshots